Understanding Heart Rate Variability
Measuring HRV
Capturing the Beat
As we've learned, Heart Rate Variability (HRV) is all about the tiny differences in time from one heartbeat to the next. To analyze this variation, we first need a precise way to record the timing of each beat. There are two primary methods for this: electrocardiography (ECG) and photoplethysmography (PPG).
The Gold Standard: ECG
The most accurate way to measure HRV is with an electrocardiogram, or ECG. This method records the heart's electrical activity. When your heart muscle depolarizes to contract, it generates a tiny electrical signal that travels through your body. An ECG machine uses electrodes placed on the skin to detect these signals and chart them as a waveform.
Each beat produces a distinct pattern. The most prominent part of this pattern is a sharp spike called the QRS complex, which represents the contraction of the ventricles. The peak of this spike is the R-wave. For HRV analysis, the crucial measurement is the time elapsed between two consecutive R-waves. This is known as the R-R interval. Because it directly measures the electrical signal that triggers the heartbeat, ECG is considered the clinical gold standard for precision.
While chest-strap heart rate monitors are a common way to get ECG-quality data outside of a clinic, a more convenient technology has emerged for everyday use.
Everyday Tech: PPG
Most modern wearables, like smartwatches and fitness trackers, use a different technique called photoplethysmography (PPG). It's an optical method that's much simpler to build into a small device.
PPG works by shining a light (usually green or infrared from an LED) onto your skin and measuring how much of that light is reflected back. When your heart beats, it pushes a pulse of blood through your arteries and capillaries. This momentary increase in blood volume absorbs more light and reflects less. The sensor detects these rhythmic changes in light reflection, which correspond directly to your pulse.
The time between these pulse peaks is called the inter-beat interval (IBI) or pulse-to-pulse interval (PPI). While not a direct measure of the heart's electrical activity like an ECG, modern algorithms have become very good at accurately identifying these peaks and calculating intervals for HRV analysis.
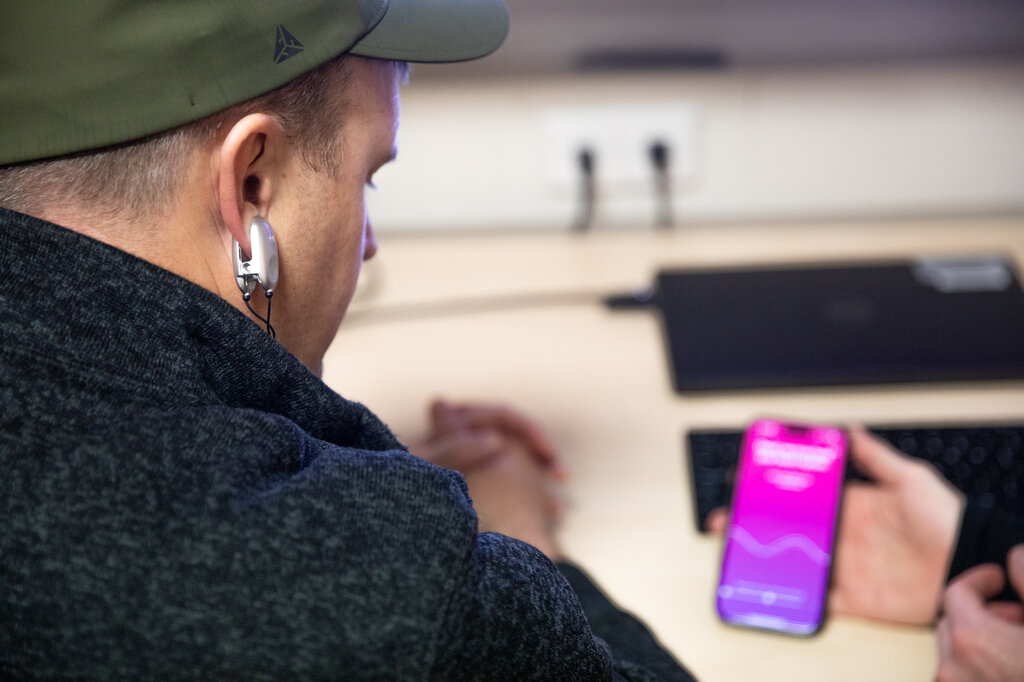
So, while ECG measures the electrical event of a heartbeat, PPG measures the resulting mechanical event—the pulse of blood flowing through your tissue.
Conditions Matter
How and when you measure HRV is just as important as the tool you use. To get reliable data that you can compare over time, you need consistency.
Duration: A very short reading might not capture the full picture of your nervous system's activity. For a good baseline measurement, a duration of 1 to 5 minutes is typically recommended. This is long enough to gather sufficient data points (the R-R intervals) for a stable analysis.
Conditions: Your body is constantly reacting to its environment. To get a true sense of your underlying physiological state, measurements should be taken under the same conditions each time. This usually means:
- At the same time of day, often right after waking up.
- In the same body position, such as sitting or lying down.
- Before any significant physical activity, caffeine, or large meals.
Controlling these factors helps ensure that the changes you see in your HRV from day to day are due to genuine shifts in your health or recovery, not just because you measured after a coffee one day and before it the next.
What does an electrocardiogram (ECG) directly measure to determine the timing of a heartbeat?
The measurement of the time between two consecutive R-waves on an ECG is known as the...
Understanding how HRV is measured is key to interpreting what it means. By using consistent methods, whether ECG or PPG, we can gather reliable data to track our nervous system's health.