Statistical Tests for Data Analysis
Chi-Square and Fisher's Exact Tests
Finding Relationships in Categories
So far, we've focused on describing a single set of data using tools like the mean, median, and standard deviation. But what if we want to see if two different categories are related? For example, does a person's preferred social media platform (like Instagram, TikTok, or X) have any connection to their preferred news source (online articles, TV, or podcasts)?
These are questions about relationships between categorical variables. We're not measuring numbers on a continuous scale; we're sorting things into buckets. To find out if there's a statistically significant association between these buckets, we need a new set of tools.
The main question we're asking is: are the patterns we see in our data real, or did they just happen by chance?
To answer this, we'll start with the most common method for categorical data: the Chi-Square test.
The Chi-Square Test
The Chi-Square test (pronounced "kye-square" and written as ) checks whether the relationship between two categorical variables is significant. It works by comparing the data we actually collected (our observed frequencies) with the data we would expect to see if there were no relationship at all between the variables (the expected frequencies).
First, we organize our data into a contingency table. Let's imagine we surveyed 200 people about whether they prefer coffee or tea, and whether they are a morning person or a night owl.
| Morning Person | Night Owl | Row Total | |
|---|---|---|---|
| Coffee | 70 | 30 | 100 |
| Tea | 20 | 80 | 100 |
| Column Total | 90 | 110 | 200 |
This is our observed data. Now, we need to figure out what we'd expect to see in each cell if there were no link between drink preference and sleep schedule. We calculate the expected count for each cell using a simple formula:
Expected Count = (Row Total × Column Total) / Grand Total
For the "Coffee / Morning Person" cell, the expected count would be (100 × 90) / 200 = 45.
If you calculate the expected counts for all four cells, you'll see they're quite different from what we observed. The Chi-Square test quantifies this difference.
The Chi-Square formula sums up the differences between the observed (O) and expected (E) values for all cells in the table.
A large value means there's a big difference between our observations and what we'd expect by chance. This suggests a real relationship exists.
After calculating the value, we determine its corresponding p-value. The p-value is the probability of seeing our results (or even more extreme ones) if there were truly no association between the variables. A small p-value (typically less than 0.05) tells us that our observed association is statistically significant. For our example data, the value is 40.4, which gives a very small p-value. We can confidently say there's a significant relationship between drink preference and sleep schedule in our sample.
When Samples Are Small
The Chi-Square test has an important assumption: the expected count in each cell should be at least 5. When this assumption isn't met, the test becomes unreliable. This often happens when you're working with a small total sample size.
Imagine we repeated our survey but only asked 20 people. Our contingency table might look like this:
| Morning Person | Night Owl | Row Total | |
|---|---|---|---|
| Coffee | 6 | 2 | 8 |
| Tea | 3 | 9 | 12 |
| Column Total | 9 | 11 | 20 |
Let's calculate the expected count for the "Coffee / Morning Person" cell: (8 × 9) / 20 = 3.6. Since 3.6 is less than 5, the Chi-Square test is not the right tool here. In these situations, we turn to Fisher's Exact Test.
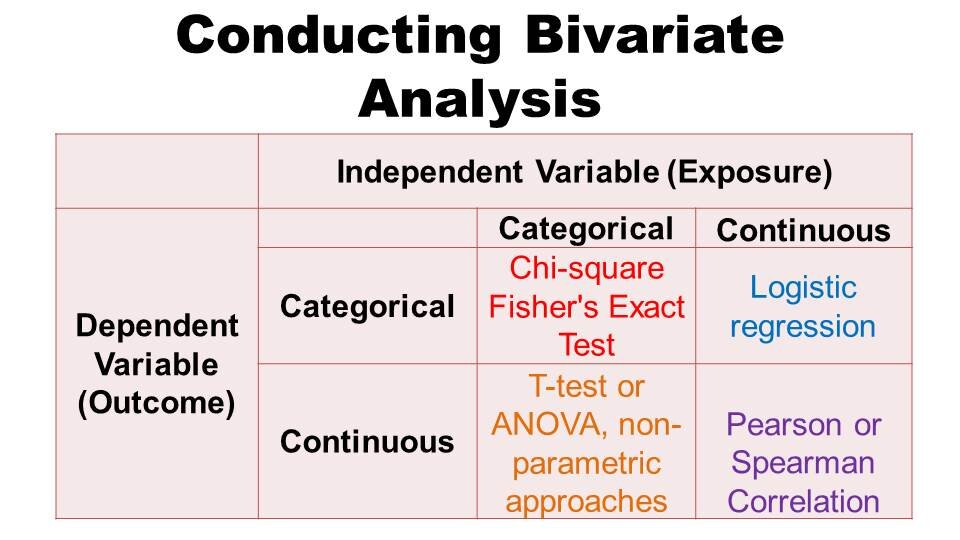
Fisher's Exact Test calculates the exact probability of getting the table results we observed, assuming the row and column totals are fixed. It doesn't rely on approximations or assumptions about sample size, making it perfect for small datasets.
It works by considering every possible table that could be formed with the same row and column totals. Then, it calculates the probability of our specific table and any other tables that show an even stronger association. Summing these probabilities gives us the exact p-value.
Because of its computational intensity, it was originally used only for 2x2 tables. Today, computers can handle it for larger tables as well.
The key takeaway: For large samples, use the Chi-Square test. For small samples where any expected cell count is below 5, use Fisher's Exact Test.
The interpretation of the p-value is the same for both tests. A p-value below your significance level (like 0.05) indicates a significant association between the variables.
What is the primary purpose of a Chi-Square () test?
A survey asks 150 people about their favorite season (Summer/Winter) and their preferred pet (Cat/Dog). In the contingency table, 80 people prefer Summer, and 60 people prefer cats. What is the expected count for the cell representing people who prefer both Summer and Cats, assuming no relationship between the variables?
These tests are powerful tools for finding relationships in categorical data, helping us move from simple descriptions to making statistical inferences.