Mastering Microsoft Workplace Tools
Word and Excel Basics
Crafting Documents with Word
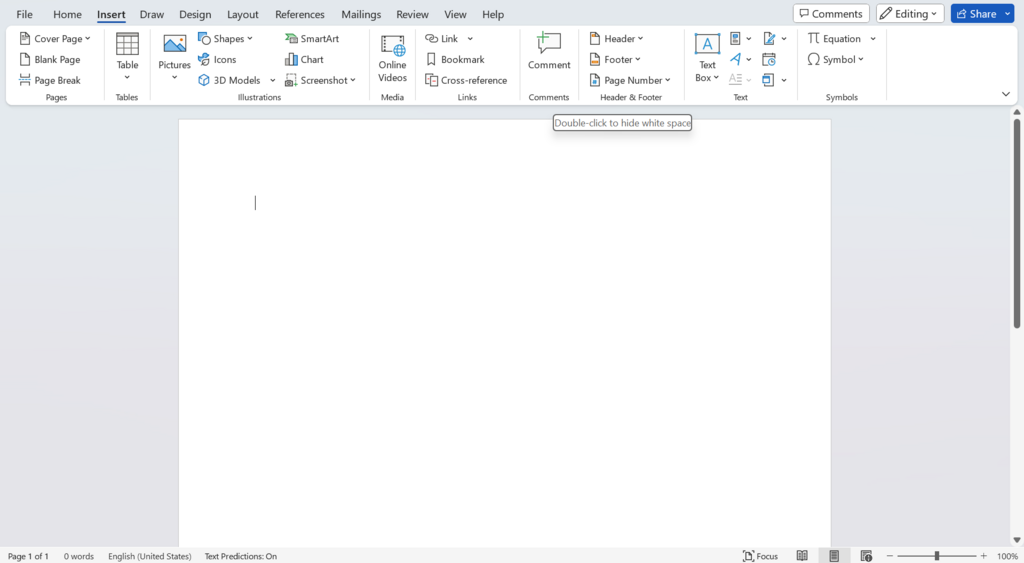
Microsoft Word is like a digital piece of paper, but with superpowers. When you open it, you're greeted with a blank document and a blinking cursor. This is your starting point for everything from a simple memo to a full-length novel.
Think of the text you type as clay. You can shape it however you like. The most common tools are found in the 'Home' tab. You can make text bold to make it stand out, italic for emphasis, or underline it. You can also change the font style and size to match the tone of your document.
To keep things organized, use headings. They break up your text into logical sections, making it easier for people to read. Think of them as chapter titles in a book. You can create different levels of headings (Heading 1, Heading 2, etc.) to create a clear structure. This also lets Word automatically generate a table of contents for you later on.
Making lists is straightforward. Use bullet points for items that don't need a specific order, like a grocery list. Use numbered lists when the sequence matters, such as following a recipe.
Word also helps you polish your writing. It automatically checks for spelling and grammar mistakes, underlining them in red or blue. You can right-click on a flagged word to see suggestions. For collaborative work, the 'Review' tab is your best friend. You can track changes, which shows every edit made, and add comments to give feedback without altering the original text.
Organizing Data with Excel
While Word handles text, Excel is the master of numbers and data. It's a spreadsheet program, which is basically a grid of cells arranged in rows and columns. Each cell can hold a piece of information, like a name, a date, or a number.
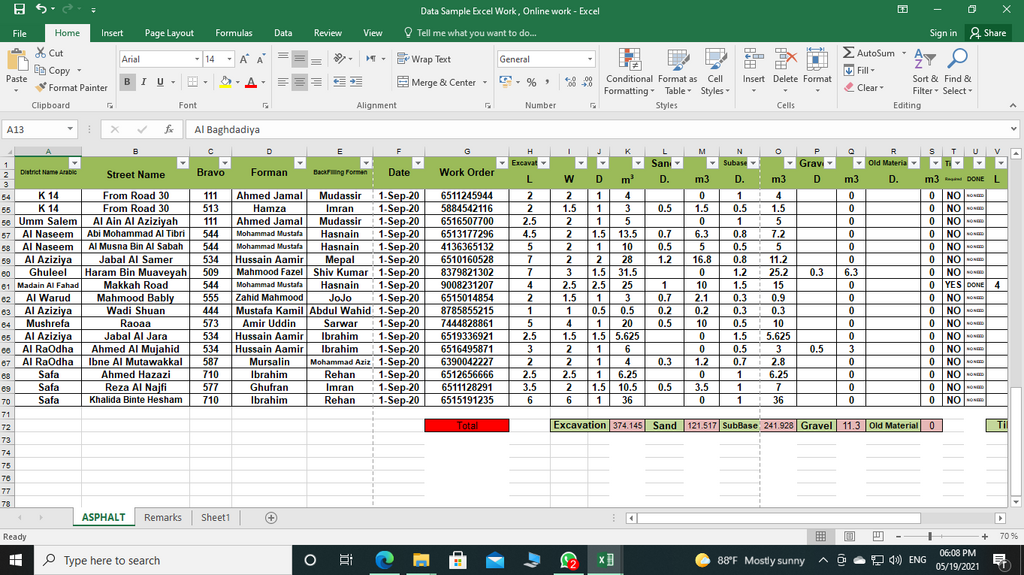
Getting started is as simple as clicking a cell and typing. You can format your data to make it more readable. For example, you can make headers bold, change the background color of certain cells to highlight them, or adjust the width of columns to fit your text.
The real power of Excel comes from formulas. A formula is a calculation that Excel performs for you. It always starts with an equals sign (=). Let's say you have a simple budget. You can list your expenses in different cells and then use a formula to add them all up.
Imagine you have the number 10 in cell A1 and 20 in cell A2. In cell A3, you could type the formula
=A1+A2. Excel would automatically display the result, 30, in cell A3. If you change the number in A1 to 15, cell A3 will instantly update to 35.
Excel has many built-in calculations called functions. These save you from typing out long formulas. The most common one is SUM, which adds up a range of cells. Instead of typing =A1+A2+A3+A4, you could just type =SUM(A1:A4).
Other basic but useful functions include:
AVERAGE: Calculates the average of a range of numbers.MAX: Finds the highest value in a range.MIN: Finds the lowest value in a range.COUNT: Counts how many cells in a range contain numbers.
Visualizing Your Data
Numbers in a grid can be hard to understand at a glance. That’s where charts and graphs come in. Excel makes it easy to turn your data into a visual story. You just need to select the data you want to visualize and choose a chart type from the 'Insert' tab.
| Chart Type | Best For |
|---|---|
| Bar Chart | Comparing values across different categories. |
| Line Chart | Showing trends or changes over time. |
| Pie Chart | Showing how parts make up a whole (proportions). |
For example, you could use a bar chart to compare monthly sales figures or a pie chart to show the percentage of your budget spent on different categories like rent, food, and entertainment. Once you create a chart, you can customize it with titles, labels, and colors to make your point even clearer.
With these basics, you can handle many common tasks in both Word and Excel. You're now ready to create clean documents, organize data, and find insights.