Yield Curve and Recession Signals
Understanding Yield Curves
What is a Yield Curve?
Imagine you're lending money. You'd probably want a higher interest rate for a 30-year loan than for a 1-year loan, right? A lot can change in 30 years, so there's more risk. That's the basic idea behind a yield curve.
A yield curve is a simple graph that plots the interest rates—or yields—of bonds with different maturity dates. A bond is essentially a loan made to an entity, usually a government or a corporation. The maturity is the time until the loan is paid back. The yield is the return an investor gets on that bond.
By plotting yields for various maturities, from short-term (like three months) to long-term (like 30 years), the yield curve gives us a snapshot of interest rates across different time horizons.
If one plots a chart of interest rates against term to maturity (such as 1 year or 10 years), the result is called the yield curve.
The Normal Shape of a Yield Curve
Most of the time, the yield curve slopes upward. This means that long-term bonds have higher yields than short-term bonds. This is considered a “normal” yield curve.
Why is this the case? There are two main reasons. First, there's greater risk associated with lending money for a longer period. Inflation could rise, or the borrower's financial health could change. Investors demand higher compensation, in the form of higher yields, for taking on this long-term risk.
Second is the time value of money. Locking up your money for 30 years means you can't use it for other investments or purchases during that time. To convince investors to part with their money for longer, issuers have to offer a better return.
This upward slope signals confidence in the economy. It suggests that investors expect the economy to grow steadily, leading them to demand higher returns for longer-term investments.
What Shapes the Curve?
The shape and slope of the yield curve aren't static. They change based on new information and expectations about the future. Three key factors drive these changes.
Economic Growth Expectations: If people believe the economy will be strong in the future, they expect more opportunities for investment. This can lead to higher inflation and interest rates down the road. In response, long-term bond yields rise to compensate, making the yield curve steeper.
Conversely, if the outlook is weak, investors might expect lower inflation and interest rates. This would push long-term yields down, causing the yield curve to flatten.
Inflation: The expectation of future inflation is a major driver of long-term yields. If investors think inflation will rise, they'll demand a higher yield on long-term bonds to protect the purchasing power of their future returns. Higher expected inflation pushes the long end of the curve up.
If inflation is expected to fall or remain low, long-term yields can decrease.
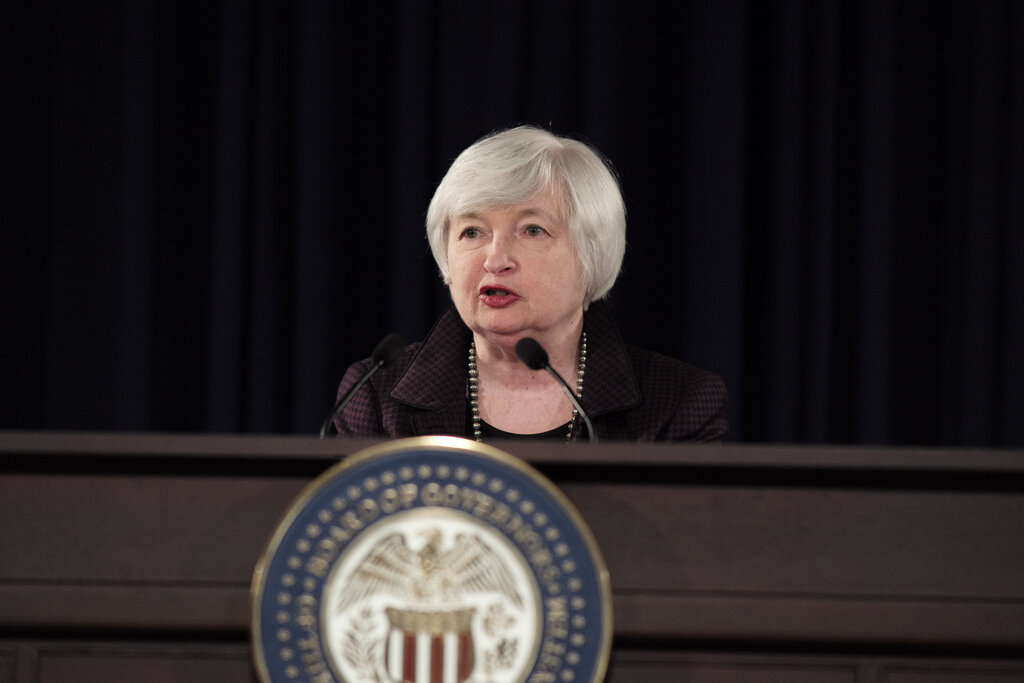
Monetary Policy: A country's central bank, like the Federal Reserve in the U.S., has a big impact on the yield curve, especially at the short end. When the central bank raises short-term interest rates to combat inflation, it directly pushes up the yields on short-term bonds. Its actions and statements also influence expectations about future growth and inflation, affecting the entire curve.
These factors are interconnected. A central bank's policy decision is often a reaction to the outlook for economic growth and inflation. Together, their interplay continuously molds the yield curve, making it a valuable barometer of economic sentiment.