Yield Curve and Recession Forecasting
Introduction to Yield Curves
What Is a Yield Curve?
A yield curve is a graph that shows the interest rates on bonds of the same credit quality but with different maturity dates. Think of it as a snapshot of how much it costs to borrow money over various lengths of time, from a few months to 30 years.
The horizontal axis of the graph plots the time until a bond matures, while the vertical axis plots the bond's yield, or the return an investor gets. By connecting the dots for different maturities, we get a curve that reveals the market's expectations for the future.
If one plots a chart of interest rates against term to maturity (such as 1 year or 10 years), the result is called the yield curve.
Why the Upward Slope?
Typically, the yield curve slopes upward. This means that long-term bonds have higher yields than short-term bonds. This makes intuitive sense. If you lend someone money for 30 years instead of 30 days, you’re taking on more risk.
Several factors contribute to this increased risk:
- Inflation Risk: Over a long period, inflation can erode the value of your money. A 4% return might seem great today, but it won't be if inflation averages 5% over the next decade. Investors demand a higher yield on long-term bonds to compensate for this uncertainty.
- Interest Rate Risk: If you buy a 30-year bond with a 4% yield, you're locked into that rate. If overall interest rates rise to 6% next year, your bond becomes less valuable. The longer the maturity, the greater the risk that interest rates will change unfavorably.
- Opportunity Cost: Locking your money away for decades means you can't use it for other investments that might pop up. This is the cost of a missed opportunity, and investors expect to be paid for it.
Because of these risks, investors demand extra compensation for holding a bond for a longer period. This extra compensation is often called a "term premium."
A healthy economy usually has a normal, upward-sloping yield curve. It signals that investors expect the economy to grow and are confident enough to lend money over the long term.
What It Tells Us
The yield curve isn't just a line on a chart; it's a powerful indicator of economic sentiment. The shape of the curve reflects the collective wisdom of millions of investors making decisions about the future.
Economists and investors watch the yield curve closely for clues about where the economy might be headed. A steeply sloping curve can suggest that investors expect strong economic growth and potentially higher inflation in the future. A flatter curve, where the difference between short-term and long-term yields is small, might suggest that investors see a slowdown ahead.
By analyzing these shifts, policymakers at central banks can gauge market expectations and adjust monetary policy accordingly. Similarly, businesses can use the yield curve to make decisions about borrowing and investment, while individual investors can use it to help shape their own financial strategies.
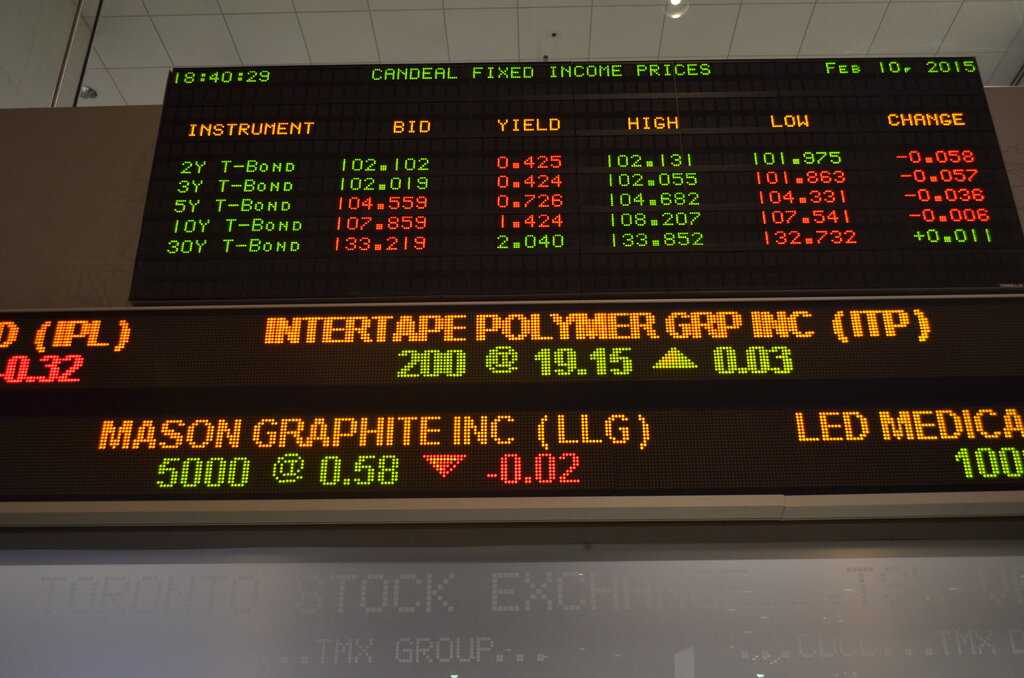
Understanding the yield curve provides a window into the complex workings of the bond market and the broader economy.