Wilderness Navigation Fundamentals
Map Reading
The Language of Maps
A topographic map is a detailed, two-dimensional representation of a three-dimensional landscape. To understand it, you first need to learn its language. This language is made of symbols, colors, and lines, all explained in a special box on the map called the legend or key.
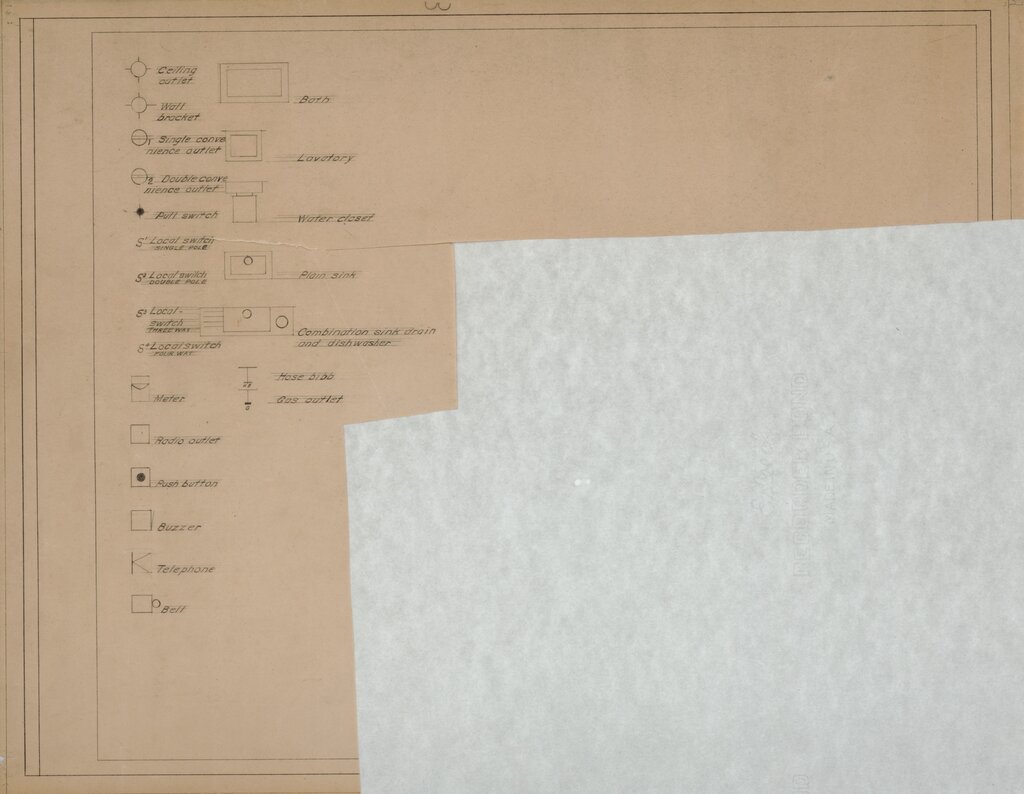
The legend is your decoder ring. It tells you what every symbol means, from tiny squares for buildings to squiggly blue lines for streams. While symbols can vary slightly from one map to another, some color conventions are fairly standard:
- Blue: Represents water features like rivers, lakes, and oceans.
- Green: Indicates areas with vegetation, such as forests or fields.
- Black and Red: Used for man-made features like roads, buildings, and political boundaries.
- Brown: Shows contour lines, which represent the shape and elevation of the land.
Here are a few common symbols you'll encounter:
| Symbol | Meaning |
|---|---|
| Dashed Line | Trail or footpath |
| Solid Blue Line | Perennial river (flows year-round) |
| Dashed Blue Line | Intermittent stream (seasonal) |
| Small Black Squares | Buildings or structures |
| ▲ | Peak or summit with elevation |
Reading the Terrain
The brown, squiggly lines covering a topographic map are called contour lines. They are the most important feature for understanding the terrain. Each contour line connects points of equal elevation above sea level. Think of it like a stack of pancakes; each pancake is a different elevation level, and the edge of the pancake is the contour line.
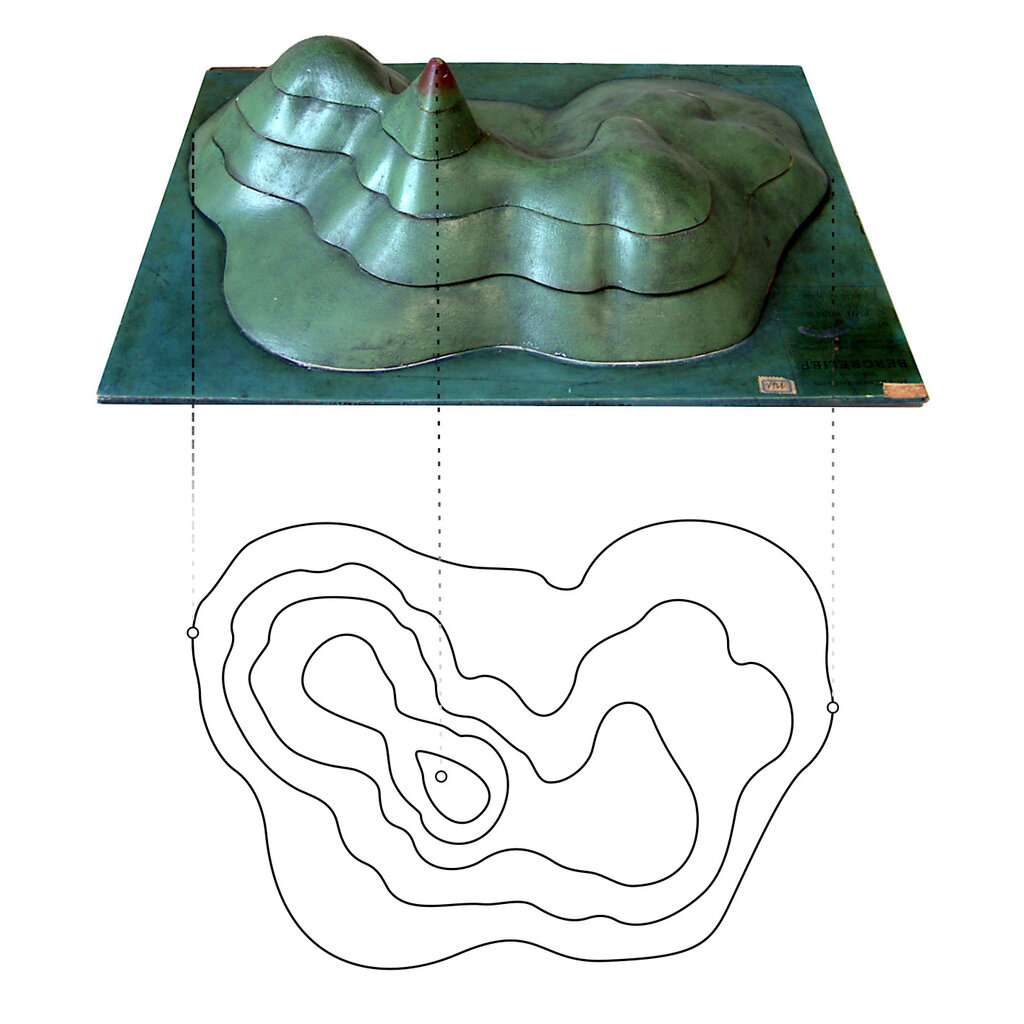
By reading how these lines are spaced and shaped, you can visualize the landscape without ever having seen it. The key is to understand a few basic rules:
-
Spacing Indicates Steepness: The closer the contour lines are to each other, the steeper the terrain. When they are far apart, the slope is gentle. If there are no contour lines, the ground is flat.
-
Circles Indicate Peaks: Contour lines form closed loops. A series of concentric loops that get smaller represents a hill or a mountain, with the smallest loop marking the summit.
-
Valleys and Ridges: Where contour lines cross a stream or valley, they form a “V” shape that always points uphill, against the flow of water. Lines that form a “U” or “V” shape pointing downhill indicate a ridge.
Contour Interval
noun
The difference in elevation between two adjacent contour lines. This value is constant for the entire map and is usually stated in the map's legend.
Measuring Distance
A map is a scaled-down version of the real world. The map's scale tells you how the distances on the map relate to the actual distances on the ground. This information is crucial for planning a trip and estimating how long it will take.
The scale is usually found in the map's margin or legend.
There are three common ways to express scale:
-
Ratio or Representative Fraction (RF): This looks like
1:24,000or1/24,000. It means one unit of measurement on the map is equal to 24,000 of the same units in the real world. So, 1 inch on the map equals 24,000 inches on the ground. -
Word Statement: This gives a direct comparison, such as "One inch equals one mile."
-
Bar Scale: This is a graphic that looks like a ruler. You can use a piece of string or the edge of a paper to mark a distance on the map, then hold it against the bar scale to read the actual distance. This is the most useful type because it remains accurate even if the map is resized.
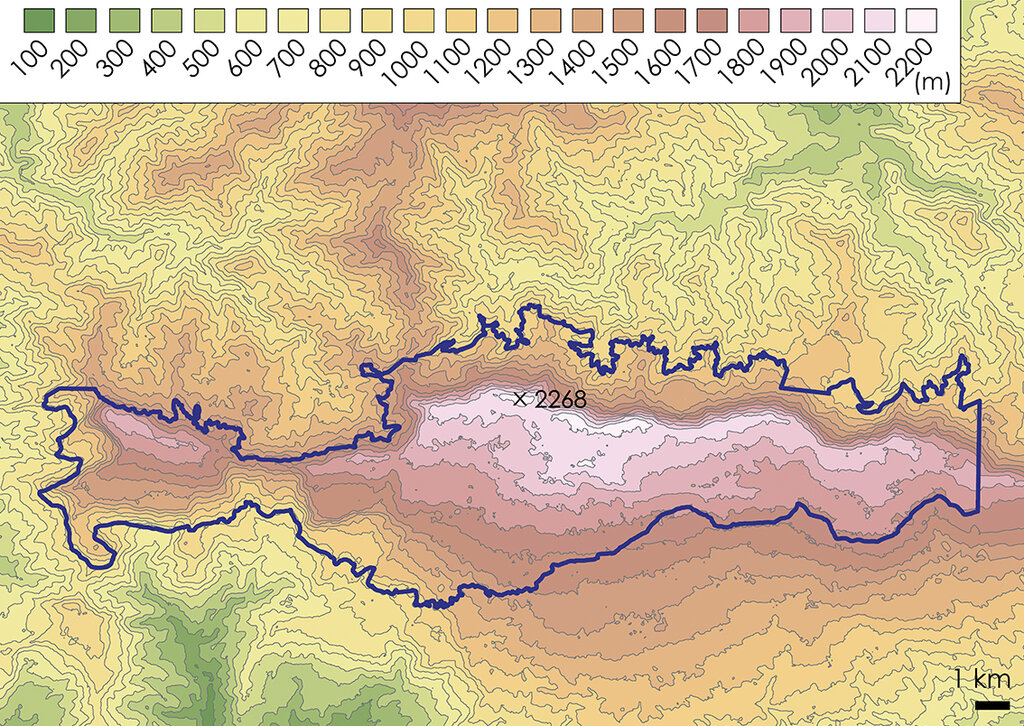
To measure distance on a map, you can use a ruler for straight lines or a piece of string for winding paths. Lay the string along your intended route on the map, mark the start and end points, and then straighten it out and measure it against the bar scale. Remember, this measures the horizontal distance. It doesn't account for the ups and downs of the terrain, so the actual distance you walk will always be slightly longer.
On a standard topographic map, what do the brown lines typically represent?
Which type of map scale remains accurate even if the map is enlarged or reduced in size?