Visualizing SETL Survey Data
Understanding Survey Data
The Language of Surveys
When you look at the results of a survey, you're not just seeing a collection of answers. You're looking at different types of data, each with its own story to tell. Understanding these types is the first step to making sense of the information you've gathered.
Categorical Data
adjective
Information that can be sorted into distinct groups or categories. The categories have no intrinsic order.
Think of categorical data as answers that fit into separate buckets. If a survey asks, "Which social media platform do you use most often?" the responses—Facebook, Instagram, TikTok—are categorical. One is not greater or less than another; they are simply different.
Ordinal Data
adjective
A type of categorical data where the categories have a natural, meaningful order or ranking.
Ordinal data introduces a sense of hierarchy. The key difference from categorical data is that the order matters. For instance, a question about how often you exercise with options like "Daily," "Weekly," or "Rarely" gives you ordinal data. We know that "Daily" is more frequent than "Weekly," but we don't know the exact difference in frequency between them.
A common ordinal scale is the Likert scale:
- Strongly Disagree
- Disagree
- Neutral
- Agree
- Strongly Agree
Finally, we have text-based data, which comes from open-ended questions. These questions don't provide options but instead ask respondents to answer in their own words.
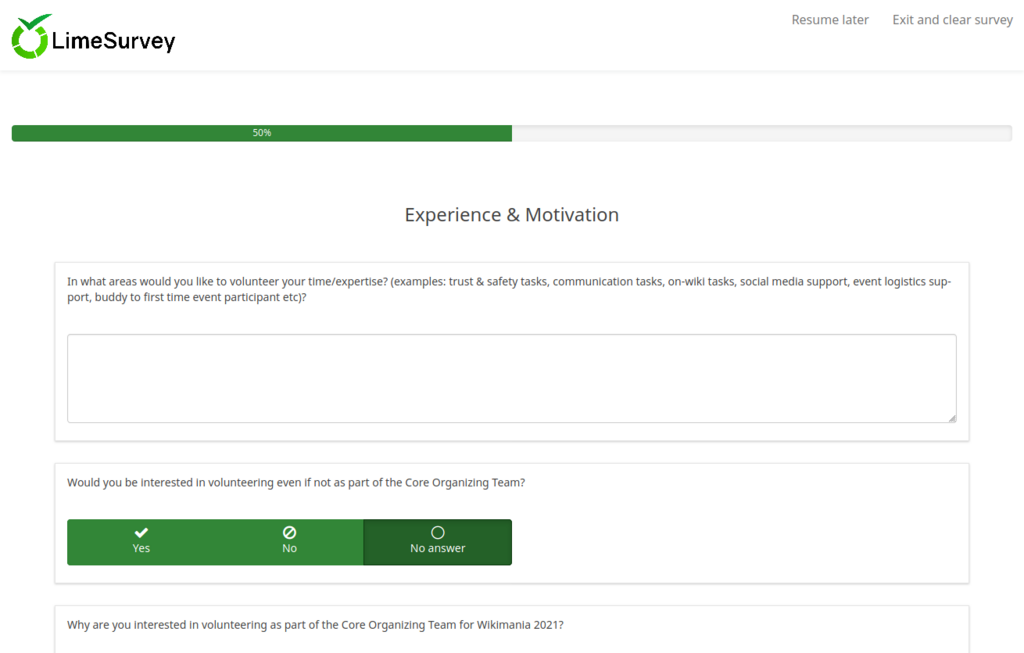
Text-based responses are rich with detail and nuance. Questions like "What could we do to improve our service?" or "Do you have any other feedback?" generate this type of data. It's qualitative and provides context that multiple-choice questions can't capture.
Challenges in the Data
Simply collecting survey data isn't enough. Raw responses can be misleading if you don't account for common pitfalls like response bias and data quality issues. Accurate interpretation is critical because these results often guide important decisions.
Always review questions asked in survey because sometimes it influence the way people response.
Response bias is a tendency for people to answer survey questions untruthfully or inaccurately. It comes in several forms.
| Bias Type | Description |
|---|---|
| Social Desirability Bias | Respondents answer in a way they think is socially acceptable, not how they truly feel. |
| Acquiescence Bias | The tendency to agree with statements, regardless of their content (also known as "yea-saying"). |
| Central Tendency Bias | A respondent's reluctance to give extreme answers (e.g., 'Strongly Agree' or 'Strongly Disagree'), preferring to stick to the middle. |
Besides bias, you also have to watch for data quality issues. These can include incomplete answers, nonsense entries in text fields, or respondents who speed through the survey without carefully reading the questions. These problems can skew your results and lead you to draw the wrong conclusions.
Strategies for Cleaner Data
The good news is that you can take steps to get more reliable data. The best strategies are proactive and built into the survey design itself.
In the design phase, using neutral, unambiguous language is key. A question like, "You don't think our prices are too high, do you?" is leading. A better version is, "How would you describe our prices?" with a scale from 'Very Low' to 'Very High'. Keeping surveys concise also helps, as respondent fatigue can lead to poor quality answers.
During implementation, guaranteeing anonymity can encourage more honest responses, especially on sensitive topics. You can also include quality checks, such as asking the same question twice in different ways or adding an attention-check question like, "Please select 'Agree' for this question."
Finally, during analysis, don't be afraid to filter out low-quality responses. If someone finished a 15-minute survey in two minutes, their data is probably not reliable. Identifying and removing these entries can significantly improve the accuracy of your findings.
Let's review these core concepts.
Now, check your understanding of these concepts.
A survey asks participants to rate their satisfaction on a scale of "Very Unsatisfied," "Unsatisfied," "Neutral," "Satisfied," and "Very Satisfied." What type of data does this question collect?
Which of the following survey questions is most likely to introduce response bias?
By understanding the different types of survey data and being mindful of potential challenges, you set the stage for a much clearer and more accurate analysis. This foundation is essential for turning raw answers into meaningful insights.