Visualizing Bird Strike Data in ArcGIS Pro
Introduction to ArcGIS Pro
Getting Started with ArcGIS Pro
ArcGIS Pro is a powerful desktop application for creating and working with geographic information. Think of it as a professional-grade tool for making maps, analyzing spatial data, and sharing your results. Unlike some older GIS software, ArcGIS Pro is built around the idea of a project. Everything you need for a particular mapping task—maps, data, tools, and layouts—is stored together in a single project file.
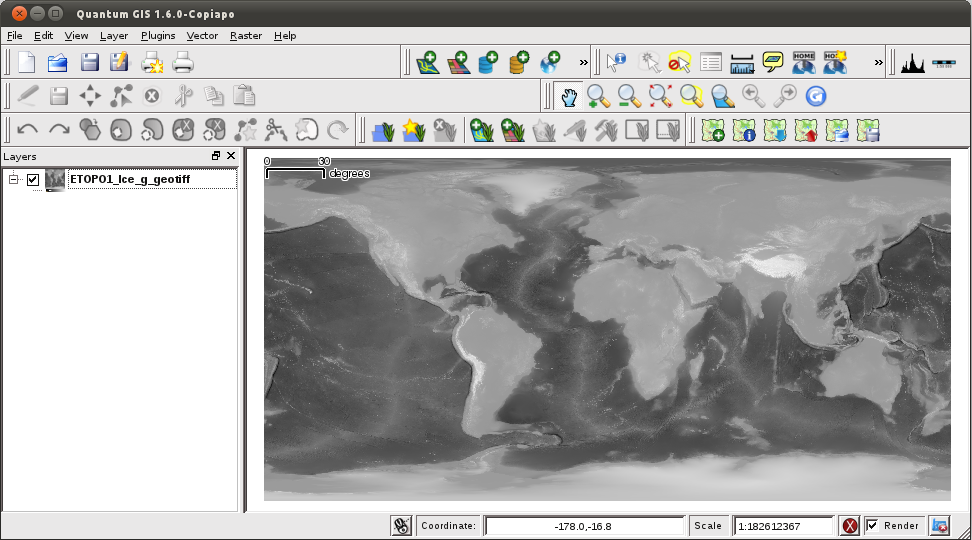
The ArcGIS Pro Interface
When you first open ArcGIS Pro, the interface is organized into three main areas: the ribbon, panes, and views.
The ribbon at the top contains a series of tabs, like 'Map', 'Insert', and 'Analysis'. Each tab gives you access to related tools and functions. The ribbon is context-sensitive, meaning the tools it displays will change depending on what you have selected in your project.
Panes are windows that display specific information. Two of the most important are the 'Contents' pane and the 'Catalog' pane. The 'Contents' pane lists all the layers in your active map and lets you control their properties. The 'Catalog' pane helps you browse and manage all the files in your project, from map data to toolboxes. You can dock, float, or close panes to customize your workspace.
Views are the central part of your project where you interact with your maps and data. The most common view is a 'Map' view for 2D work, but you can also have 'Scene' views for 3D visualization or 'Layout' views for designing printed maps.
Projects and Data
Creating a new project is your first step. When you start a project, ArcGIS Pro creates a folder on your computer to store everything associated with it. This includes your maps, the data you're using, any custom tools you create, and the final layouts you design for printing.
This project-based structure keeps your work organized and makes it easy to share with others. All the necessary files are in one predictable place.
Once your project is set up, you'll want to add data. You can do this using the 'Add Data' button on the 'Map' tab of the ribbon, or by dragging and dropping files from the 'Catalog' pane directly onto your map. Data in GIS comes in many forms, but it all gets added to the map as layers.
Each layer represents a different set of geographic features, like roads, buildings, or elevation. In the 'Contents' pane, you can turn these layers on or off by checking the box next to their name. You can also reorder them by dragging them up or down in the list. The layers at the top of the list will draw on top of the layers below them.
Navigating Your Maps
Interacting with your map is straightforward. You can use your mouse to pan (click and drag) and zoom (scroll wheel). There are also dedicated navigation tools in the 'Map' tab for more precise control, allowing you to zoom to a specific area or return to the full extent of your data.
ArcGIS Pro also excels at 3D visualization through 'Scene' views. A scene is a 3D representation of your data. This allows you to see the terrain, buildings, and other features in a more realistic context. Navigation in 3D is similar to 2D, but you also have the ability to tilt your perspective and rotate the view to see your data from any angle. This is especially useful for analyzing landscapes, cityscapes, or any data with a vertical component.
Understanding these core concepts—projects, the interface, data layers, and navigation—provides the foundation you need to start exploring the world of geographic information with ArcGIS Pro.