Understanding Variance in Math and Statistics
Introduction to Variance
Beyond the Average
Imagine two cities, Springfield and Shelbyville. Both have the same average daily temperature of 60°F. If you only look at the average, you might think they have identical climates. But averages don't tell the whole story.
In Springfield, the temperature is mild year-round, usually hovering between 55°F and 65°F. In Shelbyville, summers are scorching hot and winters are freezing cold, but the extremes balance out to the same 60°F average. The key difference isn't the center point of their data, but its spread.
This is where variance comes in. It's a way to measure how spread out, or dispersed, a set of data is.
variance
noun
A measure of how far a set of numbers is spread out from their average value.
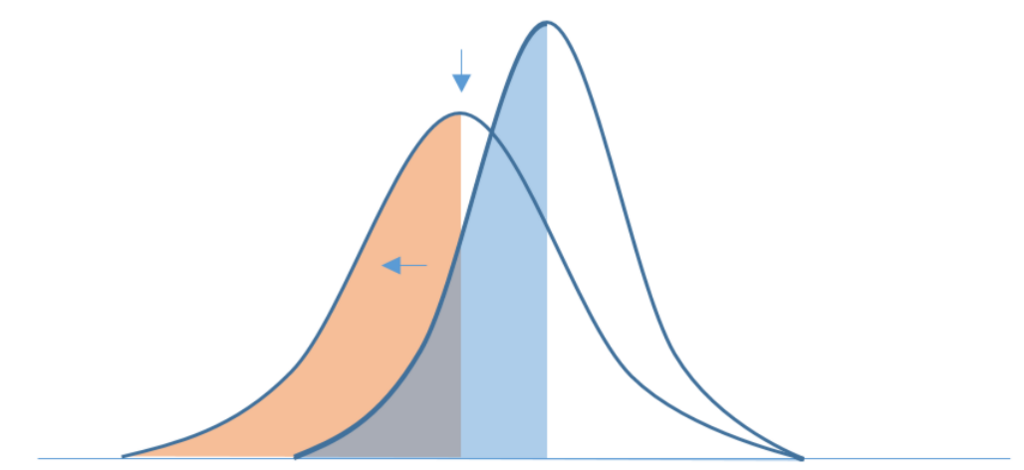
A small variance means the data points are clustered tightly around the average, like the temperatures in Springfield. A large variance means the data points are scattered far from the average, like in Shelbyville.
A Measure of Consistency
Knowing the variance gives us crucial context that the mean alone cannot. It helps us understand the consistency and predictability of a dataset. In statistics, you rarely just look at the central tendency; you almost always consider the dispersion as well.
An average tells you what to expect. Variance tells you how much that expectation might change.
Think about investing in a stock. Two different stocks might have the same average annual return of 8%. Stock A has low variance; its return is consistently around 7-9% each year. Stock B has high variance; some years it returns 30%, and other years it loses 15%. Even with the same average, the high variance of Stock B makes it a much riskier and less predictable investment.
Different Ways to Measure Spread
Variance isn't the only tool for measuring data dispersion. You might also encounter simpler measures like the range and the interquartile range (IQR).
| Measure | What It Is | Limitation |
|---|---|---|
| Range | The difference between the highest and lowest values. | Heavily influenced by single extreme values (outliers). |
| Interquartile Range (IQR) | The range of the middle 50% of the data. | Ignores the spread of the data within and outside the middle half. |
| Variance | The average of the squared differences from the Mean. | Gives weight to all data points, providing a more complete picture of dispersion. |
The range is easy to calculate but can be misleading. If you have one extremely high or low data point—an outlier—the range will be huge, even if the rest of the data is tightly clustered.
The IQR is better because it ignores outliers by focusing only on the middle half of the data. However, it gives you no information about the spread of data in the lower and upper quarters.
Variance provides a more robust and comprehensive measure. It takes every single data point into account to describe the overall spread, making it a cornerstone of statistical analysis.
Two cities have the exact same average annual temperature. What does a high variance in temperature for one of those cities suggest?
An investor is choosing between two stocks, both with the same average annual return. Stock X has a low variance, while Stock Y has a high variance. For an investor who wants a stable and predictable investment, which stock is the better choice?
By understanding variance, you gain a deeper insight into the nature of data, moving beyond simple averages to appreciate its consistency and variability.