Understanding Statistical Variance
Understanding Variance
Measuring Data Spread
Imagine two classes take the same test. Both classes have an average score of 75%. At first glance, they seem to have performed equally well. But the average only tells part of the story. In the first class, most students scored between 70% and 80%. In the second, scores were all over the place, from 40% to 100%.
The second class has a much wider spread of scores. This spread, or dispersion, is a critical piece of information. In statistics, one of the most common ways to measure this spread is by calculating the variance.
Variance
noun
A measure of how spread out a set of data points are from their average (mean) value.
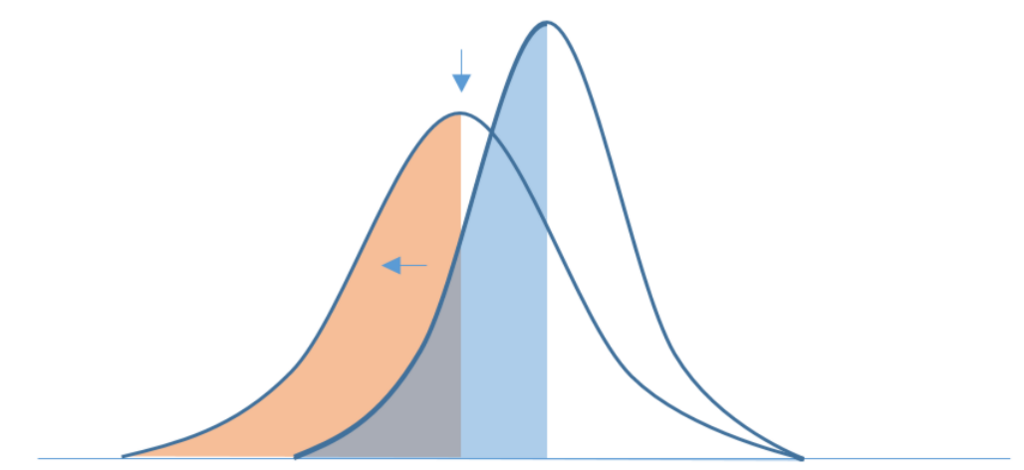
A small variance means the data points are clustered tightly around the mean. A large variance means they are scattered far from the mean. It quantifies the degree of variation in a dataset.
Why Variance Matters
Understanding variance helps us assess consistency and predictability. In manufacturing, a low variance is ideal. You want every lightbulb you produce to last for about the same amount of time. High variance would mean some burn out immediately while others last for years, signaling an unreliable production process.
In finance, variance is a common measure of risk. A stock with low variance has a stable price, offering predictable, albeit potentially small, returns. A stock with high variance might see its price swing wildly, offering a chance for big gains but also big losses. The variance tells you how much uncertainty you're dealing with.
Population vs. Sample
Before we calculate variance, we need to know what data we're working with. Are we looking at the entire group of interest (a population) or just a small piece of it (a sample)?
- Population: All members of a defined group. For example, the test scores of every 10th-grade student in a country.
- Sample: A subset of a population. For example, the test scores of 500 randomly chosen 10th-grade students.
Collecting data for an entire population is often impractical or impossible. We usually work with samples and use them to make inferences about the whole population. The formula for variance changes slightly depending on whether you have population or sample data.
Here is the formula for population variance, usually denoted by (sigma-squared).
In words, you find the mean of the population, calculate how far each data point is from that mean , square that difference, add all the squared differences together, and finally divide by the total number of data points.
When you're working with a sample, you use a slightly different formula for sample variance, denoted by .
The key difference is in the denominator. For sample variance, we divide by , not . This is known as Bessel's correction. It provides a more accurate estimate of the true population variance when you only have a sample to work with.
A Practical Example
Let's say a local coffee shop wants to check the consistency of its espresso shots. A perfect shot should be 30 ml. A barista pulls five shots (our sample) and measures their volume: 28, 31, 30, 33, and 28 ml.
Let's calculate the sample variance.
Step 1: Find the sample mean () First, we add up the volumes and divide by the number of shots, . ml.
The average volume is exactly 30 ml.
Step 2: Calculate the squared differences from the mean Now we subtract the mean from each measurement and square the result.
| Measurement () | Difference from Mean () | Squared Difference () |
|---|---|---|
| 28 | 28 - 30 = -2 | |
| 31 | 31 - 30 = 1 | |
| 30 | 30 - 30 = 0 | |
| 33 | 33 - 30 = 3 | |
| 28 | 28 - 30 = -2 |
Step 3: Sum the squared differences Next, we add up the values in the last column.
Step 4: Divide by Since we have a sample of 5 shots, we divide by .
The sample variance is 4.5. This number gives the coffee shop a quantitative measure of how consistent their espresso shots are. They could track this value over time to see if their consistency improves.
If a dataset has a very small variance, what does this imply about the data points?
In finance, variance is often used as a measure of risk. A stock with a high variance would most likely be characterized by:
Variance is a fundamental concept for understanding the nature of data. It moves beyond simple averages to give us a richer picture of distribution and reliability.