The Gaussian Function Explained
Introduction to Gaussian Functions
The Bell Curve
Many things in the world, from the heights of people to the results of a test, tend to cluster around an average value. Most results are near the middle, with fewer and fewer results the further you get from the center. This pattern is so common that it has a special name: the normal distribution. The mathematical function that describes this beautiful, bell-shaped curve is called the Gaussian function.
This formula might look complex, but it's built around just two key parameters that define the shape and position of the curve: the mean and the standard deviation.
Center and Spread
The two main ingredients of a Gaussian function are its mean, represented by the Greek letter mu (), and its standard deviation, represented by sigma ().
The mean () is the central point of the distribution. It's the value where the curve reaches its peak. If you were looking at the heights of thousands of adult men, the mean would be the average height. It tells you where the center of your data is located.
The standard deviation () measures the spread or width of the bell curve. A small standard deviation means the data points are tightly packed around the mean, resulting in a tall and narrow curve. A large standard deviation indicates that the data is more spread out, creating a shorter and wider curve.
Think of it like two archers. One is very consistent; all her arrows land close to the bullseye. Her shots have a small standard deviation. The other archer is less consistent; his arrows are scattered more widely around the target. His shots have a large standard deviation.
Key Features
Every Gaussian curve shares a few distinct properties. First, it is perfectly symmetrical around its mean. The left side is a mirror image of the right side. This also means that for a normal distribution, the mean, median (the middle value), and mode (the most frequent value) are all the same.
The curve's distinctive shape is why it's famously called a "bell curve." It peaks at the mean and slopes downward on both sides, getting closer and closer to the horizontal axis but never quite touching it.
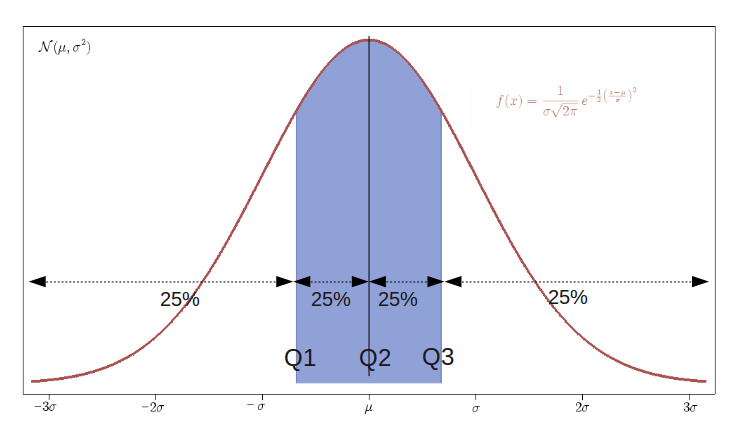
One of the most important properties is the area under the curve. No matter how tall and skinny or short and wide the curve is, the total area beneath it is always equal to 1. This is because the total area represents 100% of all possible outcomes.
This makes the Gaussian function incredibly useful for understanding probability. The area under a specific section of the curve tells you the probability of a random data point falling within that range. For instance, the area under the curve between two values, say and , gives you the chance of observing a result between and .
Let's check your understanding of these core concepts.
The characteristic shape of a normal distribution is often called a...
In a Gaussian function, what does the parameter (mu) represent?
Understanding the Gaussian function's definition, parameters, and properties is the first step toward seeing how it helps describe and predict patterns all around us.