The Double Pareto LogNormal Distribution
Introduction to Probability Distributions
What Are Probability Distributions?
A probability distribution is a way to understand and describe all the possible outcomes of a random event and how likely each one is. Think of it as a complete blueprint for uncertainty.
For example, when you roll a standard six-sided die, you know the possible outcomes are 1, 2, 3, 4, 5, or 6. If the die is fair, each of these outcomes has an equal chance of happening: a 1 in 6 probability. This complete list of outcomes and their associated probabilities is the die's probability distribution.
In short, a probability distribution links every possible outcome of a random process with its probability of occurring.
All probability distributions follow two fundamental rules:
- The probability of any single outcome must be between 0 and 1 (or 0% and 100%).
- The sum of the probabilities for all possible outcomes must equal 1 (or 100%).
Random events, or random variables, come in two main flavors: discrete and continuous.
Discrete
adjective
A variable with a countable number of possible outcomes. Examples include the number of heads in three coin flips (0, 1, 2, or 3) or the result of a die roll (1, 2, 3, 4, 5, or 6).
Continuous
adjective
A variable that can take on any value within a given range. Examples include a person's height, the temperature of a room, or the exact time it takes to run a mile.
How we describe the probabilities for these two types is slightly different. For discrete variables, we use a Probability Mass Function (PMF), which gives the exact probability for each specific outcome. For our fair die, the PMF would state that , , and so on.
For continuous variables, the probability of getting one exact value is practically zero. What's the chance someone is exactly 1.8 meters tall, down to the last atom? Instead, we use a Probability Density Function (PDF). A PDF tells us the relative likelihood of values, and we use it to find the probability that an outcome falls within a certain range.
Common Distributions
While countless distributions exist, a few appear so often they're worth knowing by name.
The Uniform Distribution
This is the simplest type. In a uniform distribution, every possible outcome is equally likely. Our fair die roll is a perfect example of a discrete uniform distribution.
A continuous uniform distribution would be something like a random number generator that produces a value between 0 and 1. Any number in that range has the same chance of being selected. Its PDF looks like a simple rectangle.
The Normal Distribution
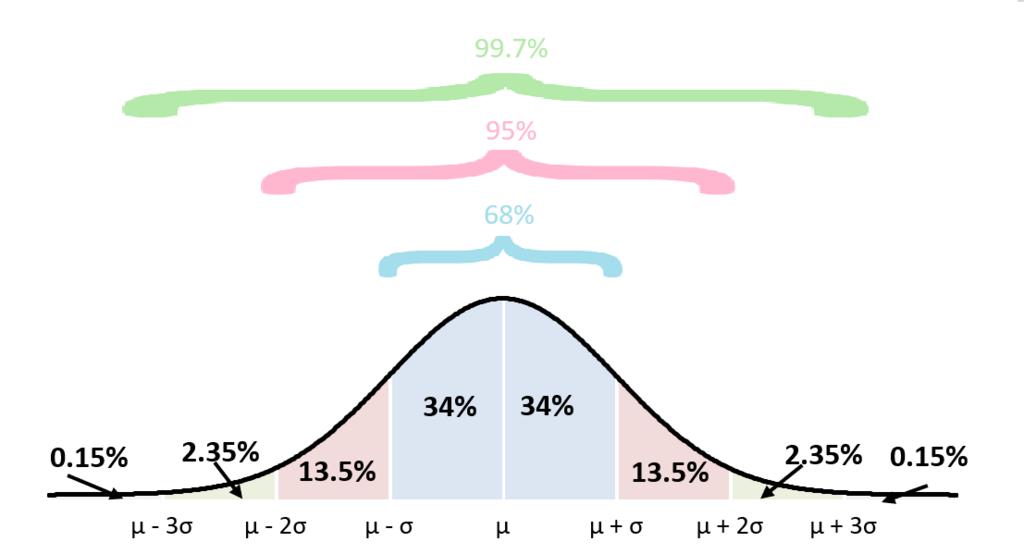
You probably know this one as the "bell curve." It's famous for a reason. The normal distribution shows up everywhere in the natural world, describing things like human height, measurement errors, and blood pressure.
It's defined by its mean (), which is the center peak of the curve, and its standard deviation (), which describes how spread out the data is. A key feature is its symmetry around the mean.
The Exponential Distribution
This distribution describes the time between events that happen at a constant average rate. For example, it can model the time between customer arrivals at a store or the time until a machine part fails.
A defining characteristic is that it's "memoryless." This means the probability of an event happening in the future doesn't depend on what has already happened. If a lightbulb has an exponential lifespan, its chances of failing in the next hour are the same whether it's brand new or has been on for 100 hours.
These are just a few of the foundational distributions. Understanding them provides the essential building blocks for tackling more specialized and complex ones.
Which of the following is a fundamental rule that all probability distributions must adhere to?
For a continuous random variable, like a person's exact height, what kind of function is used to find the probability that an outcome falls within a certain range?