Temporal Disaggregation of Rainfall
Introduction to Rainfall Data
How We Measure Rain
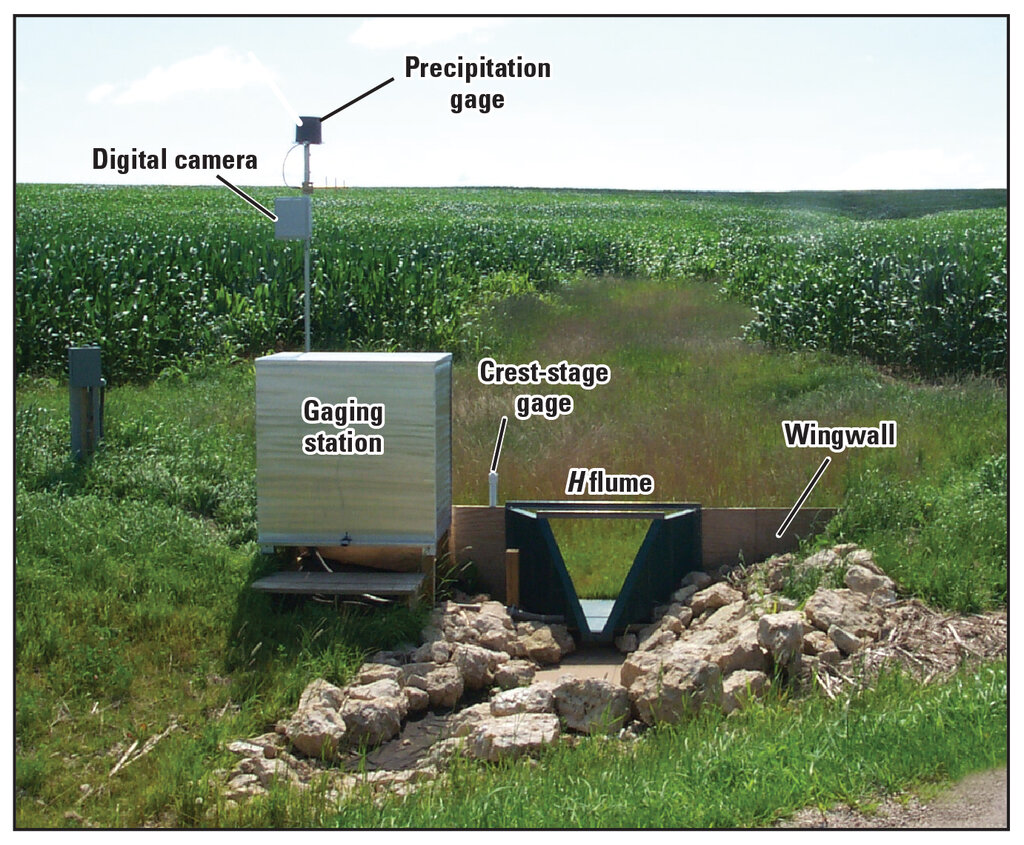
The simplest way to measure rainfall is with a rain gauge. At its most basic, this is just an open-topped container that collects rain. By measuring the height of the water in the container, we know how much rain has fallen over a certain area. This is often expressed in millimeters or inches.
Of course, scientists use more sophisticated versions. A common type is the tipping-bucket rain gauge. It has a tiny seesaw-like mechanism inside. As one side fills with a small, known amount of rain (say, 0.2 mm), it tips, empties, and brings the other side up to be filled. Each tip is recorded electronically, allowing for a very precise, continuous measurement of rainfall.
From Gauges to Grids
A single rain gauge only tells you what’s happening in one specific spot. To understand rainfall over a city, a watershed, or a country, we need a network of these gauges. Data from many stations are collected and combined to create a bigger picture.
But even a dense network has gaps. That's where remote sensing technologies like weather radar and satellites come in. Radar works by sending out microwave energy. Raindrops reflect this energy back to the radar, and the strength of the returning signal tells us how intense the rain is. Satellites can observe cloud tops and use infrared and other sensors to estimate how much rain is falling over vast areas, including oceans where rain gauges are scarce.
When the Rain Fell
Knowing how much rain fell is only half the story. We also need to know when it fell. This is called temporal resolution—the frequency at which data is recorded.
Low-resolution data might give you one total rainfall number for an entire day. High-resolution data can tell you how much rain fell every hour, or even every few minutes.
Think of it like this: a single photograph of a finish line tells you who won the race. A video of the entire race shows you how they won—who was leading at the start, who had a burst of speed, and who fell behind. High-resolution rainfall data is like the video; it shows the full story of a storm.
| Time | Low Resolution (Daily) | High Resolution (Hourly) |
|---|---|---|
| Midnight - 11:59 PM | 24 mm | - |
| 12:00 PM | 24 mm | 0 mm |
| 1:00 PM | 24 mm | 0 mm |
| 2:00 PM | 24 mm | 20 mm |
| 3:00 PM | 24 mm | 4 mm |
| 4:00 PM | 24 mm | 0 mm |
In the table above, both datasets record the same total rainfall. But the high-resolution data reveals that the entire 24 mm fell in a short, intense burst between 2:00 PM and 4:00 PM.
Why Details Matter in Hydrology
This detail is critical for hydrology, the study of water movement. A gentle, all-day drizzle of 24 mm will likely soak into the ground, replenishing soil moisture and groundwater. But 24 mm of rain in a single hour will overwhelm the soil's ability to absorb it.
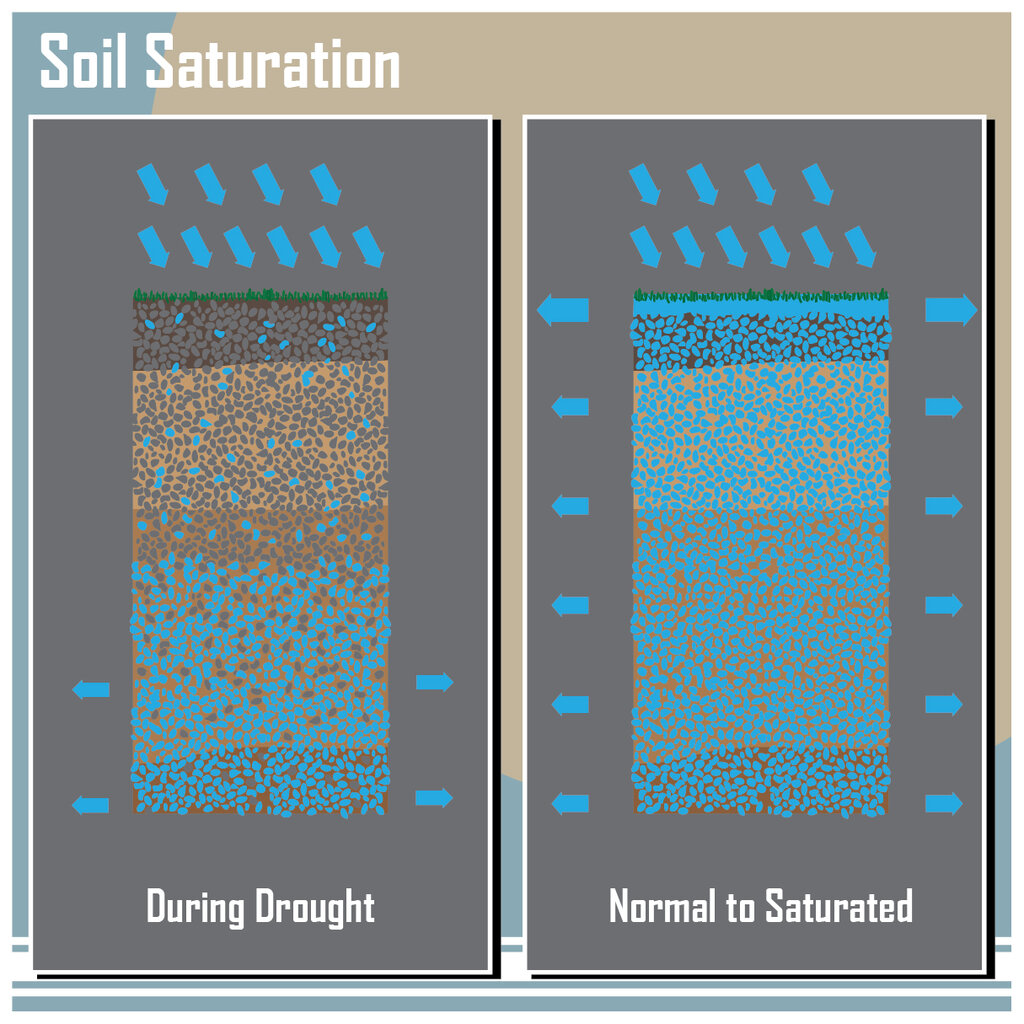
The excess water becomes surface runoff, flowing quickly into streams and rivers. This can lead to flash floods, soil erosion, and the washing of pollutants into waterways. For engineers designing storm drains, ecologists studying river health, or forecasters issuing flood warnings, knowing the intensity of rainfall is just as important as knowing the total amount.
Because transport of nonpoint source pollution is mainly driven by the movement of water, an understanding of hydrology and the hydrologic cycle is critical to managing our water resources to support human needs.
High-resolution data allows hydrologists to build more accurate models of how a watershed will respond to a storm. It helps them predict peak river flows, identify areas at risk of flooding, and manage water resources more effectively. Without that temporal detail, we're just guessing.
What is the primary mechanism of a tipping-bucket rain gauge?
Why are remote sensing technologies like weather radar important for measuring rainfall, even when rain gauge networks exist?
Understanding how we measure rain and why the timing is so important is the first step in analyzing its impact on the world around us.