Technical Analysis with TradingView
Introduction to Technical Analysis
Reading the Market's Mind
Technical analysis is the art of forecasting future price movements based on past ones. Instead of digging into a company's financial health, a technical analyst studies price charts and trading volumes. The core idea is that all the information you need about an asset is already reflected in its price.
Think of it like a weather forecast. Meteorologists study historical weather patterns to predict if you'll need an umbrella tomorrow. Similarly, technical analysts study historical market patterns to anticipate where prices might go next.
This approach isn't about calculating a company's intrinsic value. It's about understanding market psychology—the collective actions of millions of buyers and sellers—by reading the story told by a price chart. Its main purpose is to identify trends and patterns that can signal trading opportunities.
Core Principles
The practice of technical analysis is built on three foundational beliefs. Understanding them is key to understanding the entire approach.
- The Market Discounts Everything. This is the most important principle. A technical analyst believes that any factor that could affect a price—from economic news and company earnings to investor sentiment—is already priced into the asset. If the price is all-encompassing, then the only thing worth studying is the price movement itself.
- Price Moves in Trends. Price changes are not random. Once a trend is established, the price is more likely to continue in that direction than move against it. The main goal for an analyst is to identify the current trend (up, down, or sideways) and make decisions based on it.
- History Tends to Repeat Itself. Market psychology is fairly constant over time. People tend to react to similar situations in predictable ways, which leads to recurring patterns on price charts. Because these patterns have worked in the past, analysts assume they may work again in the future.
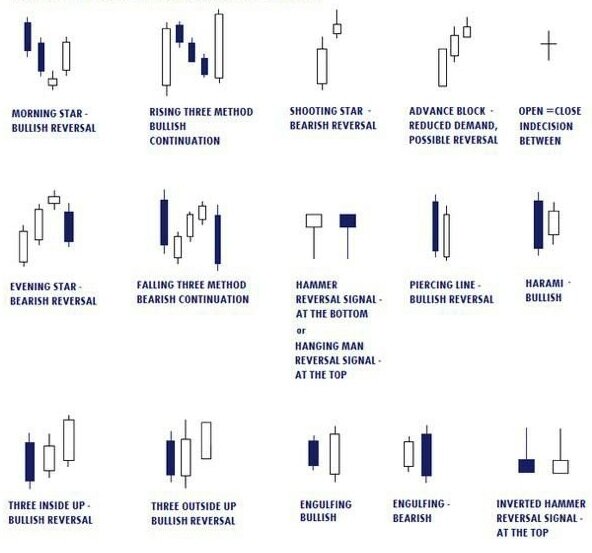
These repeating patterns are the building blocks of technical analysis. Over decades, traders have identified dozens of them, from simple trendlines to more complex formations that can signal a potential reversal or continuation of a trend.
Two Sides of a Coin
Technical analysis is often contrasted with fundamental analysis, which focuses on a company's financial health and economic factors. One isn't necessarily better than the other; they are simply different tools for different jobs.
| Feature | Technical Analysis | Fundamental Analysis |
|---|---|---|
| Focus | Price charts and market data | Company financials and economic health |
| Goal | Identify trends and timing | Determine intrinsic value |
| Tools | Chart patterns, indicators | Financial statements, industry reports |
| Timeframe | Short to medium-term | Long-term |
A fundamental analyst acts like a business detective, trying to determine if a stock is over or undervalued. A technical analyst is more like a crowd psychologist, trying to gauge the mood of the market to predict its next move. Many investors use both approaches together.
Use fundamental analysis to identify quality stocks and technical analysis to find the best entry and exit points.
By understanding the trends and patterns in price movements, traders can make more informed decisions about when to enter or exit a position, regardless of an asset's long-term value.