Technical Analysis for Traders
Introduction to Technical Analysis
Reading the Market's Mind
Imagine trying to predict the weather. You could study meteorology, analyzing atmospheric pressure, temperature, and humidity to build a forecast from the ground up. Or, you could just look at the sky. Are there dark clouds gathering? Is the wind picking up? This is the essential difference between fundamental analysis and technical analysis.
Fundamental Analysis is the process of analyzing a company’s actual business performance to decide whether its stock is worth buying.
Fundamental analysis is like the meteorologist. It dives deep into a company's health, looking at its revenues, earnings, assets, and liabilities. It examines the industry and the overall economy. The goal is to determine a company's intrinsic value and decide if its stock is a good long-term investment.
Technical analysis, on the other hand, is like looking at the sky. It isn't concerned with why the clouds are gathering. It simply observes that dark clouds often lead to rain. Technical analysts study price charts and trading volume, looking for patterns and trends. They believe all the important information about a company is already baked into its stock price.
The core of technical analysis rests on three key assumptions.
Three Core Principles
1. Market Action Discounts Everything This is the cornerstone. Technical analysts believe that any factor that could affect a stock's price—from earnings reports to investor sentiment to a CEO's health—is already reflected in its current price. They argue that studying the price action is a shortcut to analyzing all those disparate factors. You don't need to know the news; the chart tells you how the market is reacting to it.
2. Prices Move in Trends Once a trend is established, it's likely to continue. An object in motion stays in motion. This principle suggests that traders can identify a trend (up, down, or sideways) and trade with it. The main purpose of charting is to spot these trends early in their development to ride them for a profit.
3. History Repeats Itself Price movements are not random. They often fall into patterns that have appeared before. These patterns are born from market psychology—the collective emotions of fear, greed, and hope that drive trading decisions. Because human nature is fairly constant, these patterns tend to repeat over time. A technical analyst studies past patterns to gain an edge in predicting future movements.
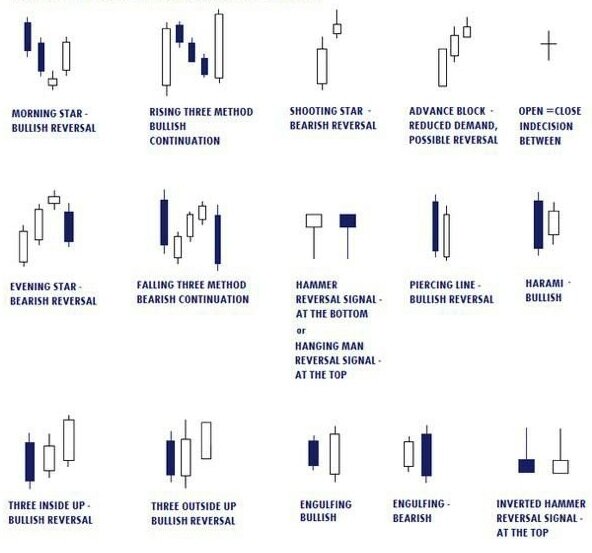
The Psychology of the Crowd
At its heart, technical analysis is a study of mass psychology. A price chart is a visual record of the battle between buyers (bulls) and sellers (bears). When buyers are more aggressive, prices trend up. When sellers take control, prices trend down.
Patterns on a chart reflect the recurring psychological states of market participants. For example, a
support
noun
A price level where a downtrend can be expected to pause due to a concentration of demand or buying interest.
level might form where many investors feel a stock is a bargain, causing a wave of buying that stops a price decline. Conversely, a
resistance
noun
A price level where an uptrend can be expected to pause temporarily, due to a concentration of selling interest.
level might appear where many investors decide to sell and take profits, halting a price rise. These levels are not magic; they are visible representations of the market's collective memory and emotional turning points.
By learning to read the charts, technical analysts aim to gauge the market's mood and make decisions based on probabilities, not just a company's balance sheet.
Technical analysis doesn't predict the future with certainty. Instead, it provides a framework for analyzing the probabilities of future market movements.
Now that you understand the core ideas, let's review with some flashcards.
Ready to test your knowledge? Take this quick quiz.
An investor spends their time analyzing a company's balance sheet, income statement, and the overall health of its industry. This investor is primarily using:
What is the core principle behind the technical analysis assumption that 'Market Action Discounts Everything'?
Understanding these foundational concepts is the first step. You're not looking at a random squiggle of lines, but a story of human emotion and market forces playing out in real time.