Sum of Squares Error Explained
Introduction to Regression
What is Regression?
Regression analysis is a statistical method for figuring out the relationship between different variables. Think of it as a way to see how one thing affects another. For example, how do the hours you spend studying impact your test score? Or how does a company's advertising budget affect its sales? Regression helps us model and quantify these connections.
Linear regression analysis is used to predict the value of a variable based on the value of another variable.
At its core, it's about drawing a line through a set of data points to see the trend. This line helps us make educated guesses, or predictions, about future outcomes.
Dependent and Independent Variables
To understand regression, you need to know about two types of variables. The first is the one you're trying to predict or explain. This is called the dependent variable.
Dependent Variable
noun
The main variable you are trying to predict or understand. It's also known as the outcome or response variable.
The other variable is the one you believe has an impact on the dependent variable. We call this the independent variable.
Independent Variable
noun
The variable that you think influences the dependent variable. It's also known as the predictor or explanatory variable.
Let's stick with the study example. Your test score is the dependent variable because it depends on how much you study. The hours you study is the independent variable because it's the factor you are using to make a prediction.
The Goal of Regression
So why do we use regression? The primary goal is twofold: to understand the relationship between variables and to predict future outcomes.
For example, an ice cream shop owner might use regression to understand the relationship between the daily temperature (independent variable) and ice cream sales (dependent variable). By analyzing past data, she can build a model that predicts how many ice cream cones she'll sell on a hot day. This helps with inventory management and staffing.
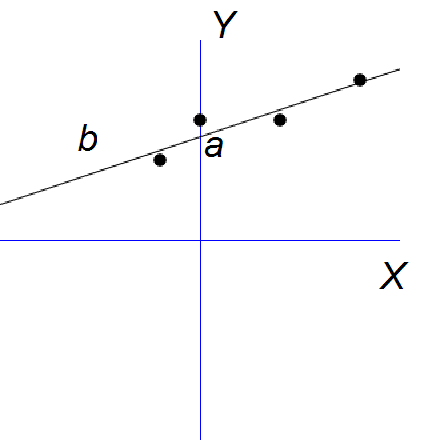
This predictive power is why regression is a cornerstone of machine learning, finance, and scientific research. It helps us move from simply describing data to making informed forecasts based on it.
While there are many types of regression, like logistic and polynomial regression, the most fundamental is simple linear regression. It models the relationship between two variables using a straight line. It's the perfect starting point for understanding how regression works.
The Simple Linear Regression Formula
The relationship in a simple linear regression model is described by a straightforward formula:
Let's break that down:
- Y is the dependent variable (what you're trying to predict).
- X is the independent variable (what you're using to predict).
- (beta-zero) is the intercept. It's the value of Y when X is 0. Think of it as the starting point.
- (beta-one) is the slope. It tells us how much Y changes for a one-unit increase in X. It represents the strength and direction of the relationship.
- (epsilon) is the error term. It accounts for the random variation or the part of Y that the model can't explain. No model is perfect, and epsilon represents this imperfection.
By finding the best values for the intercept () and the slope (), we can create a line that best fits our data and use it to make predictions.
What are the two primary goals of regression analysis?
A researcher is studying the effect of hours spent studying on exam scores. In this scenario, what is the 'dependent variable'?