Strategic Trading and Market Analysis
Technical Analysis Tools
Reading the Signals
Price charts tell a story, but technical indicators are the tools that help you read it. They translate raw price and volume data into clearer signals about trends, momentum, and volatility. Think of them less as crystal balls and more as specialised lenses, each designed to highlight a different aspect of market behaviour. The key isn't to rely on a single tool, but to learn how to combine their signals to build a more complete picture.
Smoothing Out the Noise
The most fundamental indicator is the moving average. It smooths out day-to-day price fluctuations to reveal the underlying trend. There are two main types you'll encounter:
- Simple Moving Average (SMA): This is the straightforward average price over a set period (e.g., 50 days or 200 days).
- Exponential Moving Average (EMA): This is a weighted average that gives more significance to recent prices. This makes the react more quickly to new price information than the SMA.
Neither is inherently better; the EMA is more responsive, while the SMA is smoother and less prone to false signals. The real power comes from watching how they interact. A popular strategy is to track a shorter-term average (like a 50-day) and a longer-term one (like a 200-day). When the short-term average crosses above the long-term one, it's often seen as a bullish signal (a "golden cross"). When it crosses below, it's considered a bearish signal (a "death cross").
Gauging Momentum and Volatility
While moving averages tell you about the trend's direction, other indicators measure its strength and the market's volatility.
The Relative Strength Index, or , is a momentum oscillator. It measures the speed and change of price movements on a scale of 0 to 100. A reading above 70 is typically considered "overbought," suggesting the asset may be due for a pullback. A reading below 30 is considered "oversold," suggesting it may be poised for a rebound. These are not sell or buy signals on their own, but rather warnings that momentum might be overextended.
To gauge volatility, many traders turn to Bollinger Bands. This tool consists of three lines: a simple moving average in the middle, with an upper and lower band that are typically two standard deviations away from the centre line. When the bands are close together (a "squeeze"), it indicates low volatility and is often seen as a precursor to a significant price move. When the bands expand, it shows volatility is increasing.
Price action near the outer bands is also significant. A price touching the upper band might suggest the asset is becoming overbought, while a touch of the lower band could indicate it's oversold. However, in a strong trend, prices can "walk the band" for extended periods.
Confirmation is Key
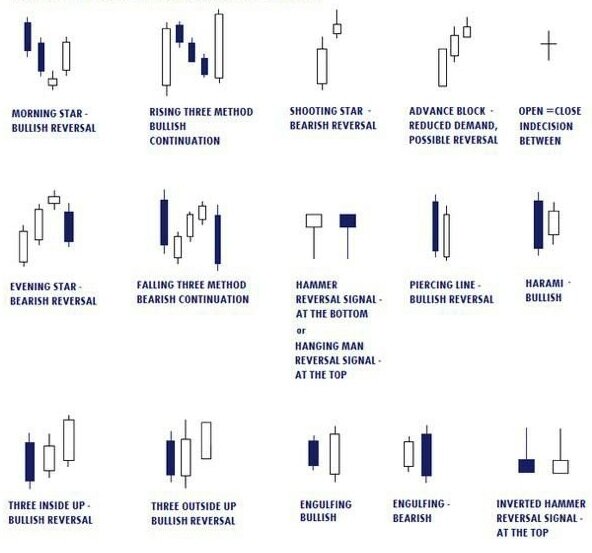
No single indicator is foolproof. The most effective approach is to use them in combination to confirm signals. For example, if a stock's price breaks above a key resistance level, is the move supported by high volume? High suggests strong conviction behind the move, making the breakout more credible. Low volume might suggest it's a false signal that could quickly reverse.
Similarly, you could look for convergence. Does an RSI oversold signal (below 30) coincide with the price hitting the lower Bollinger Band and finding support near a historical price level? A combination of signals from different types of indicators, all pointing to the same conclusion, provides a much stronger basis for a trading decision.
Successful technical traders combine multiple indicators, look for pattern confirmation, use proper risk management, and study historical trading data.
Using these tools helps validate key support and resistance levels. If a price is approaching a previous support level, and indicators like the RSI are entering oversold territory, it strengthens the case that the support will hold. This layering of evidence is what separates disciplined analysis from mere guesswork.
Time to check your understanding of these key indicators.
What is the primary role of technical indicators in analysing price charts?
Which type of moving average gives more weight to recent prices, making it react more quickly to new information?
By learning to interpret the signals from these tools, you can move beyond simply watching prices and start understanding the dynamics driving them.