Strategic Stock Market Mastery
Macroeconomic Price Drivers
Interest Rates and Valuation
Central bank interest rate decisions are more than just headlines; they are a direct input into how every stock is valued. The most common way to determine a company's intrinsic value is through a Discounted Cash Flow (DCF) analysis. This method projects a company's future cash flows and then discounts them back to what they are worth today.
The key variable here is the discount rate, . It's a combination of the risk-free rate (typically the yield on government bonds) and an equity risk premium. When a central bank like the Federal Reserve raises its benchmark rate, the risk-free rate climbs with it. This directly increases the discount rate used in valuation models.
A higher discount rate means future cash flows are worth less in today's dollars. This forces valuations down, a phenomenon known as multiple compression. This effect is especially harsh on growth stocks. Their valuations are heavily weighted on earnings expected far in the future, and those distant cash flows get discounted more severely with every rate hike. This is why you often see tech and biotech stocks fall sharply when the Federal Open Market Committee signals a more aggressive policy.
Inflation and Sector Performance
Inflation directly impacts corporate profitability and consumer behavior, creating clear winners and losers across different market sectors. The most direct impact is on profit margins. When input costs like raw materials and wages rise, companies must either absorb those costs, shrinking their margins, or pass them on to customers through higher prices.
Companies with strong brand loyalty and pricing power, often called "moats," can raise prices without losing business. Others cannot. This dynamic is a major reason why certain sectors outperform during inflationary periods.
| Sector | Performance in High Inflation | Rationale |
|---|---|---|
| Utilities & Healthcare | Outperform | These sectors provide essential services. Consumers will continue to pay for electricity and medical care regardless of price, giving these companies stable cash flow and pricing power. |
| Consumer Staples | Outperform | Companies selling necessities like food and household products can typically pass on cost increases to consumers. Demand is inelastic. |
| Consumer Discretionary | Underperform | Businesses selling non-essential goods and services (e.g., luxury items, travel, high-end electronics) suffer as consumers cut back on spending to afford necessities. |
| Energy & Materials | Outperform | These sectors directly benefit from rising commodity prices, which are often a primary driver of inflation itself. Their revenues are directly linked to the price of oil, gas, and metals. |
Watching the Consumer Price Index (CPI) is crucial. A higher-than-expected CPI reading not only signals margin pressure but also increases the likelihood of central bank rate hikes, creating a dual headwind for the market, especially for interest-rate sensitive and discretionary sectors.
Reading the Economic Tea Leaves
Beyond inflation and interest rates, traders watch several key economic reports as leading indicators of economic health, which in turn influences corporate earnings expectations. Two of the most important are employment data and Purchasing Managers' Indexes (PMI).
Non-Farm Payrolls (NFP): Released on the first Friday of each month in the U.S., this report is a powerful snapshot of the labor market. A strong NFP number suggests a robust economy, which is good for corporate profits. However, an exceptionally strong report can spook markets. Why? Because a tight labor market leads to wage growth, which can fuel inflation and pressure the central bank to raise interest rates.
Purchasing Managers' Index (PMI): This is a survey-based indicator that measures the health of the manufacturing and services sectors. A reading above 50 indicates expansion, while a reading below 50 signals contraction. The is prized because it's a forward-looking indicator; it reflects what purchasing managers are planning to do, offering a glimpse into future economic activity and potential supply chain pressures.
A surprise in these reports often triggers immediate institutional trading. A much weaker-than-expected PMI might cause algorithms to sell cyclical stocks and buy defensive bonds in milliseconds, anticipating an economic slowdown.
This brings us to the strategy of sector rotation. As the economy moves through its cycles, from expansion to peak, contraction, and trough, different sectors take the lead. By analyzing macro data, investors can anticipate these shifts.
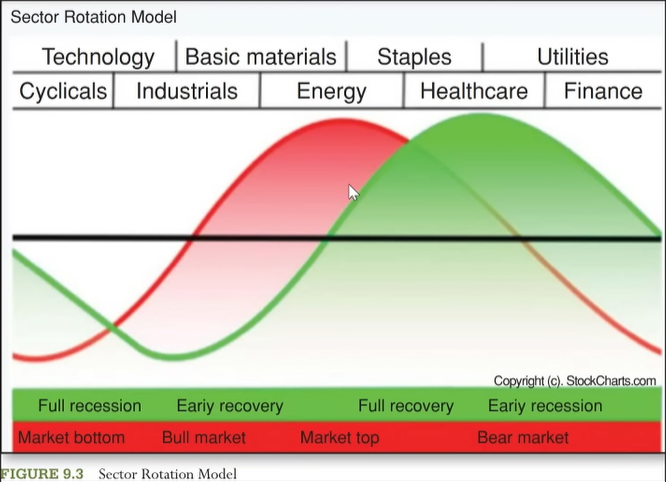
For example, as leading indicators like the PMI start to decline after a peak, smart investors may begin rotating out of economically-sensitive sectors like Technology and Industrials and into defensive sectors like Healthcare and Utilities, which tend to hold their value better during a downturn. This proactive strategy is at the heart of connecting macroeconomic analysis to portfolio management.
Now, test your understanding of how these macroeconomic forces influence the market.
When a central bank increases its benchmark interest rate, how does this typically affect a stock's valuation using a Discounted Cash Flow (DCF) model?
Why are growth stocks often more severely impacted by rising interest rates than value stocks?
Understanding these relationships is not about predicting the future with certainty. It's about recognizing the major forces that shape market trends and using that knowledge to build a more resilient and responsive investment strategy.