Strategic Market Trading and Risk Management
Advanced Chart Patterns
Patterns of Sudden Reversal
Advanced chart patterns often signal a dramatic shift in market psychology. Unlike simpler formations, these patterns can indicate an abrupt and powerful change in direction. They capture moments when one side of the market decisively loses control to the other.
The key to these patterns is the price gap—an empty space on the chart where no trading occurred. Gaps signify a strong imbalance between buyers and sellers, often caused by overnight news or a sudden change in sentiment.
First, let's look at the Kicker pattern. This is one of the most powerful reversal signals you can find. It consists of two candles. After a clear trend, the first candle follows that trend. Then, the price gaps significantly in the opposite direction, and the second candle continues strongly that new way.
A bullish Kicker appears in a downtrend. A large bearish candle is followed by a gap up into a large bullish candle. This shows that sentiment flipped overnight from extremely bearish to extremely bullish. The bears were trapped.
A bearish Kicker is the opposite. It forms in an uptrend, with a bullish candle followed by a gap down into a large bearish candle.
Another powerful gap-based formation is the Island Reversal. This pattern forms when a price gap leaves a small cluster of candles isolated from the rest of the price action. It's bookended by two gaps.
A Bearish Island Reversal happens at the top of an uptrend. The price gaps up (an exhaustion gap), trades for a few sessions, and then gaps down (a breakaway gap), leaving the recent highs stranded like an island. This traps all the buyers who bought at the top.
A Bullish Island Reversal is the mirror image at the bottom of a downtrend, with an exhaustion gap down followed by a breakaway gap up.
Exhaustion and Gradual Turns
Not all major reversals happen in an instant. Some patterns show the gradual exhaustion of a trend, culminating in a decisive turn. The Abandoned Baby is one such pattern, and it's even rarer and more reliable than the classic Morning and Evening Star formations.
The key feature is a Doji candle that gaps away from the candles before and after it. A Bearish Abandoned Baby occurs after a strong uptrend. A large bullish candle is followed by a gap up to a Doji. Then, the next session gaps down, forming a large bearish candle. That lone Doji is the "abandoned baby," representing a moment of peak indecision and exhaustion before the sellers take complete control.
The Bullish Abandoned Baby is its opposite, appearing at the bottom of a downtrend. A large bearish candle is followed by a gap down to a Doji, which is then followed by a gap up to a large bullish candle.
The Tower Top and Tower Bottom patterns illustrate a more drawn-out reversal. A Tower Top forms after an uptrend with one or more long bullish candles (the first tower). Price then enters a consolidation phase with several small-bodied candles. Finally, the reversal is confirmed by one or more long bearish candles (the second tower). This pattern shows a slower transfer of power from buyers to sellers.
When a Trend Pauses, Not Reverses
It's equally important to identify patterns that signal a trend is likely to continue. These are called continuation patterns. They represent a temporary pause or profit-taking before the dominant trend reasserts itself.
The Three-Line Strike is a deceptive but powerful continuation pattern. In a bullish trend, it forms with three strong bullish candles. The fourth candle, however, is a very large bearish candle that opens higher but closes below the open of the first candle. It looks like a terrifying reversal, but it's often just a sharp pullback caused by profit-taking. The original uptrend frequently resumes shortly after.
The psychology of the Three-Line Strike is that it shakes out weak hands, allowing the trend to continue with stronger conviction.
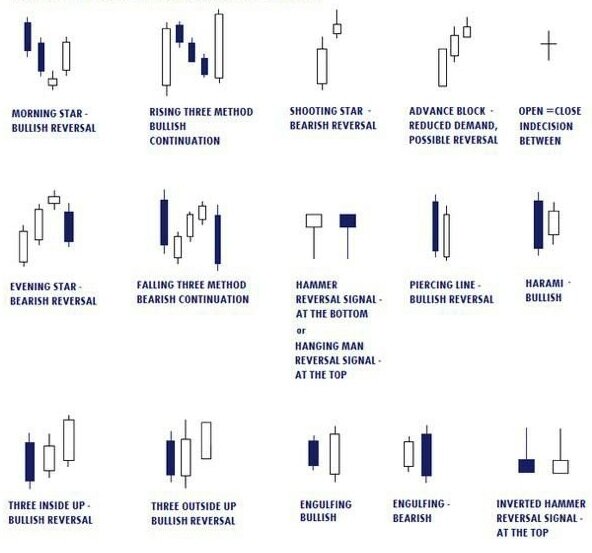
A more classic continuation pattern is the Rising Three Methods. It starts with a long bullish candle. This is followed by three (or sometimes two or four) small bearish candles that trade downwards but remain within the range of the first candle's body. The pattern is completed by a fifth candle that is strongly bullish and closes above the high of the first candle. This shows that sellers tried to reverse the trend but lacked the strength, and the buyers easily regained control.
The Falling Three Methods is the bearish equivalent, occurring in a downtrend.
Ready to test your knowledge? Let's see if you can spot these patterns.
Which pattern is characterized by a Doji candle that gaps away from the candles both before and after it, signaling a powerful trend reversal?
In a strong uptrend, you see three large bullish candles followed by a fourth candle that opens higher but then closes below the open of the very first bullish candle. What continuation pattern might this be?
Recognizing these advanced patterns takes practice. They provide a deeper look into market psychology than simpler formations, signaling everything from violent sentiment shifts to temporary pauses in a strong trend. By adding them to your toolkit, you can better interpret the complex stories the chart is telling.