Strategic Forex Market Trading
Advanced Chart Patterns
Reading the Market's Story
Price charts tell a story about the constant battle between buyers and sellers. While a single candlestick gives you a snapshot of that struggle over a specific period, larger patterns formed by groups of candlesticks reveal the plot. These patterns show how market psychology is shifting, offering clues about whether a trend is likely to continue or reverse.
Think of these patterns not as foolproof signals, but as recurring narratives. Recognizing them helps you understand the underlying market dynamics and anticipate potential future movements. We'll explore two main types: reversal patterns, which suggest a trend is ending, and continuation patterns, which suggest it's just taking a breath.
When the Trend Turns
Reversal patterns are some of the most sought-after formations because they can signal a major shift in direction. They indicate that the dominant force (buyers in an uptrend, sellers in a downtrend) is losing steam and the opposition is gaining control.
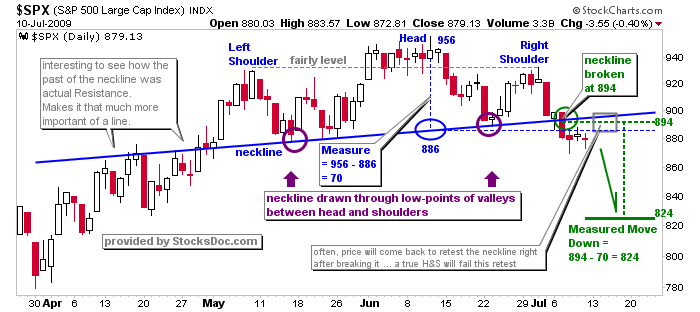
The classic reversal pattern is the Head and Shoulders formation. During an uptrend, the price makes a peak (the left shoulder), pulls back, then pushes to an even higher peak (the head). It pulls back again but fails to reach the previous high, forming a lower peak (the right shoulder). Connecting the two lows of the pullbacks creates the 'neckline'. A decisive break below this neckline is the classic signal that sellers have taken over and the uptrend has likely reversed.
Then you have Double Tops and Double Bottoms. A Double Top looks like the letter 'M' and forms when a price hits a resistance level, pulls back, and then fails to break that same level a second time. This failure shows that buyers lack the conviction to push prices higher, often leading to a reversal downwards. A Double Bottom is the inverse, looking like a 'W'. It occurs when the price finds support at a certain level twice, signaling that sellers can't push it any lower and buyers are stepping in.
Pausing for Breath
Not every pattern signals a reversal. Continuation patterns suggest the market is simply taking a short break before continuing in its original direction. These are periods of consolidation where profit-takers exit and new participants enter, building momentum for the next move.
Flags are a common example. A Bull Flag appears after a strong upward move (the 'pole') and looks like a small, downward-sloping channel. This brief dip is just some light selling before the uptrend resumes. A Bear Flag is the opposite: a short rally in an upward-sloping channel after a sharp drop, before the price falls again.
Triangles also signal continuation. An Ascending Triangle forms when there's a flat resistance level on top and a rising trendline of support below. This pattern shows buyers are becoming more aggressive, making higher lows as they push against a stubborn price ceiling. A breakout above the resistance is often explosive. A Descending Triangle is the bearish version, with a flat support level and a descending trendline of resistance, suggesting a breakdown is imminent.
Confirmation Is Key
Identifying a pattern isn't enough. You need to look for confirmation to avoid falling for 'fakeouts'. Two of the most important confirmation tools are volume and price rejection.
A chart pattern without volume confirmation is like a rumor without a source—interesting, but not trustworthy.
In a healthy trend, volume should increase in the direction of the trend and decrease during pullbacks. When you see a breakout from a pattern, like a flag or triangle, it should be accompanied by a spike in volume. This surge indicates strong participation and conviction behind the move. In the Forex market, where true volume data isn't centralized, traders often use tick volume from their broker as a proxy. While not perfect, a significant increase in tick activity serves a similar purpose, showing a rush of trading interest.
Similarly, look for signs of price rejection at key boundaries of the pattern. Long wicks on candlesticks at a resistance level in a double top, for example, show that buyers are being forcefully turned away. This visual cue reinforces the idea that the level is significant and likely to hold.
By combining pattern analysis with confirmation from volume and price action, you move from simply spotting shapes on a chart to reading the story of the market. This deeper understanding helps you differentiate high-probability setups from market noise.
What do chart patterns primarily help traders understand?
A pattern that forms during an uptrend, consisting of a peak (left shoulder), a higher peak (head), and a lower peak (right shoulder), is known as a...