Stock Trading and Financial Analysis
Quantitative Equity Valuation
The Three Core Statements
Fundamental analysis starts with a company's three primary financial statements. Think of them as different lenses for viewing a business's health. You don't look at just one; you synthesize all three to get a complete picture.
The Balance Sheet is a snapshot. It shows what a company owns (Assets) and owes (Liabilities) at a single point in time. The remainder is the owners' stake (Shareholders' Equity). The core equation is always: Assets = Liabilities + Equity.
Next, the Income Statement measures performance over a period, like a quarter or a year. It tells a story of revenues and expenses, culminating in the famous "bottom line": net income. It shows whether the business is profitable.
Finally, the Cash Flow Statement tracks the movement of actual cash. It breaks down cash activities into three categories: operating (from core business activities), investing (buying or selling assets), and financing (raising or repaying debt, issuing stock). A company can be profitable on its income statement but still run out of cash, which is why this statement is critical.
Analyzing the Numbers
With the statements in hand, the real analysis begins. Since you have a data background, think of these as datasets waiting for exploration. Two simple yet powerful techniques are horizontal and vertical analysis.
Horizontal analysis compares financial data over time. For example, you might look at revenue growth year-over-year. A 10% increase in revenue is a clear signal, but seeing that it grew 20% the year before and 30% the year before that provides crucial context about slowing momentum.
Vertical analysis looks at relationships within a single period. On an income statement, you might express each line item as a percentage of total revenue. This reveals a company's cost structure. For instance, if (COGS) is 70% of revenue, you know that for every dollar of sales, 70 cents goes directly into producing the product.
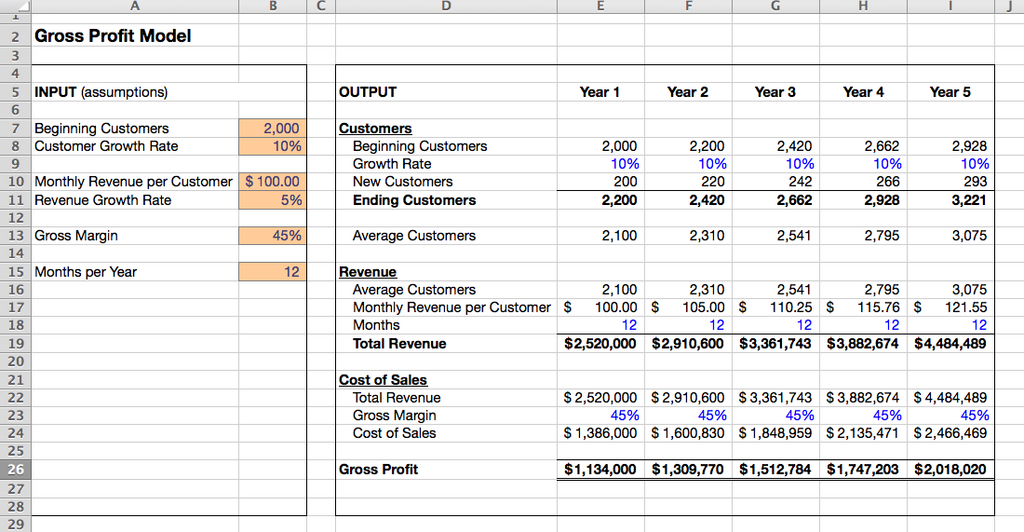
Beyond trends, we use ratio analysis to standardize financials and compare companies of different sizes. These ratios fall into several key categories:
- Liquidity Ratios: These measure a company's ability to meet its short-term obligations. The Current Ratio (Current Assets / Current Liabilities) is a classic example.
- Solvency Ratios: These gauge a company's long-term financial health and its ability to meet long-term debt obligations. The Debt-to-Equity ratio is a key indicator of financial and risk.
- Profitability Ratios: These show how well a company generates profit from its revenue and assets. Return on Equity (ROE), which measures how much profit is generated for each dollar of shareholders' equity, is a crucial metric for investors.
From Analysis to Valuation
Analyzing financial statements tells you about a company's health, but it doesn't directly tell you what its stock should be worth. That's the goal of valuation: to determine a company's intrinsic value, which can then be compared to its market price.
One of the most fundamental valuation methods is the Discounted Cash Flow (DCF) model. The idea is that a company's value is the sum of all the cash it will generate in the future, with a twist: cash tomorrow is worth less than cash today. So, we must discount those future cash flows back to their present value.
Forecasting cash flows far into the future is difficult. To solve this, analysts often use a two-stage DCF model. First, they project cash flows for a specific period (like 5-10 years). Then, they calculate a "terminal value" to represent the company's value for all years beyond that point.
A common way to calculate terminal value for a stable, mature company is the Gordon Growth Model. This model assumes the company's dividends will grow at a constant rate forever.
Finally, no valuation is complete without looking at relative valuation. This involves comparing the company to its peers using multiples. Common examples include the Price-to-Earnings (P/E) ratio, Price-to-Sales (P/S), and Enterprise Value-to-EBITDA (EV/EBITDA). If a company is trading at a P/E of 15 while its competitors average 25, it might be undervalued—or there might be a good reason for the discount. Your job as an analyst is to figure out which it is.
Which financial statement is most critical for understanding if a company can meet its short-term obligations and avoid running out of cash, even if its income statement shows a profit?
An analyst is examining a company's income statement by expressing each line item (like Cost of Goods Sold and Operating Expenses) as a percentage of total revenue. What type of analysis is this?
By combining financial statement analysis with valuation models and relative multiples, you can build a robust, data-driven opinion on a stock's intrinsic value.