Stock Market Technical Analysis
Candlestick Market Psychology
The Story in a Single Candle
A candlestick chart tells a story. Each candle is a snapshot of a battle between buyers (bulls) and sellers (bears) over a specific period. By learning to read the candle's shape, you can understand the market's psychology without needing any complex indicators.
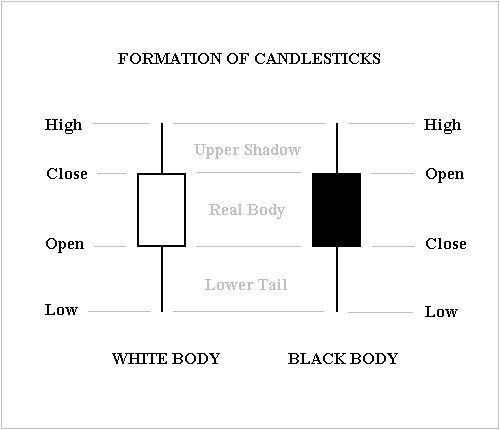
You already know that each candle shows four key pieces of data: the open, high, low, and close prices. But these aren't just numbers; they are psychological benchmarks for that trading session.
- Open: The starting point. It's the price where the session's trading began.
- High: The peak of optimism. This is the highest price buyers were willing to pay.
- Low: The depth of pessimism. The lowest price sellers managed to drive the asset to.
- Close: The final verdict. This is the most important price, as it shows who won the battle for that period. If the close is above the open, the bulls won. If it's below, the bears did.
The Body and Wicks
The story of the candle is told through the relationship between its body and its wicks (also called shadows).
The body is the thick part of the candle, representing the distance between the open and close prices. A long body shows strong conviction. A long green body means buyers were in control from start to finish. A long red body means sellers dominated.
The wicks are the thin lines extending above and below the body. They represent the price extremes that were tested but ultimately rejected. A long upper wick shows that buyers tried to push the price higher, but sellers overwhelmed them and forced the price back down. This is a sign of selling pressure. Conversely, a long lower wick shows that sellers tried to push the price lower, but buyers stepped in and drove it back up, a sign of buying pressure.
To read candlesticks, you must interpret how the body and wick length translate into price action and trading psychology.
Extremes of Sentiment
Two special candle types represent the extreme ends of the sentiment spectrum: Marubozu and Doji.
A Marubozu is a candle with a full body and no wicks. It signifies absolute control. A green Marubozu means the open was the low price and the close was the high price; buyers were in complete command. A red Marubozu is the opposite, showing total domination by sellers.
On the other hand, a is a candle with a very small or non-existent body, meaning the open and close prices are nearly identical. It looks like a cross or a plus sign. A Doji represents indecision and a stalemate between bulls and bears. Neither side could gain control, signalling a potential turning point in the market.
Volume Confirms the Story
A candle's story is powerful, but it's more believable when it's backed by volume. Volume measures how many shares were traded during that period. It acts as a confirmation of the price action.
A long green candle (strong buying) is much more significant if it occurs on high volume. This shows that many participants were involved and confident in the upward move. A long green candle on low volume is less convincing; it could just be a temporary blip.
Similarly, a on high volume is a critical signal. It means a huge battle was fought between bulls and bears, but ended in a draw. This level of indecision after a big fight often precedes a major price move. The breakout from that Doji's range is often very powerful.
By combining the shape of the candle with its corresponding volume, you get a much clearer picture of market sentiment.
In the context of a single candlestick, which price is considered the most important for determining who won the battle between bulls and bears for that period?
What does a long lower wick on a candlestick typically indicate?
Reading an individual candle is the first step. By understanding the psychology behind its formation, you can begin to interpret the market's mood in real-time.