Stock Fundamental Knowledge Graphs
Introduction to Knowledge Graphs
Beyond Lists and Tables
Most data is stored in tables, like a spreadsheet. Each row is an item, and each column is a detail about that item. This is useful, but it has a big limitation: it doesn't show how different items are connected.
A knowledge graph is a way of organizing information that focuses on connections. Think of it less like a spreadsheet and more like a spider's web or a map of the brain. It's a network that links concepts, objects, and people, showing how they relate to one another.
In a knowledge graph, each node represents a distinct concept or entity, and the edges illustrate the nature of their interaction, enabling advanced reasoning... and contextual elucidation.
The main goal is to move beyond simple data points and understand the rich context surrounding them. Instead of just knowing that "Paris" is a city and the "Eiffel Tower" is a landmark, a knowledge graph knows that the Eiffel Tower is located in Paris. This ability to map relationships is what makes them so powerful.
The Building Blocks
Knowledge graphs are built from a few simple parts. Understanding them is key to seeing how the whole system works.
Entity
noun
Any distinct object, person, place, concept, or event. In a knowledge graph, entities are the main points of information, also known as nodes.
Entities are the nouns of our data world. They can be concrete, like a specific person, or abstract, like a company's mission statement.
Next, we need to connect these entities. That's where relationships come in. Relationships, also called edges, are the verbs. They describe how two entities are linked. For example, Leonardo da Vinci painted the Mona Lisa. The word "painted" is the relationship.
Finally, we have Attributes. These are the details that describe an entity, like a person's birth date or the height of a building. They add depth and specificity to our nodes.
This structure, often called a triple, is the fundamental unit of a knowledge graph: an Entity, a Relationship, and another Entity. Or, (Subject, Predicate, Object). For example: (Mona Lisa, located in, The Louvre).
Why Use a Graph?
Representing data as a graph of interconnected nodes has huge advantages. It mirrors how we naturally think about the world—as a network of relationships. This makes it incredibly flexible and powerful for asking complex questions.
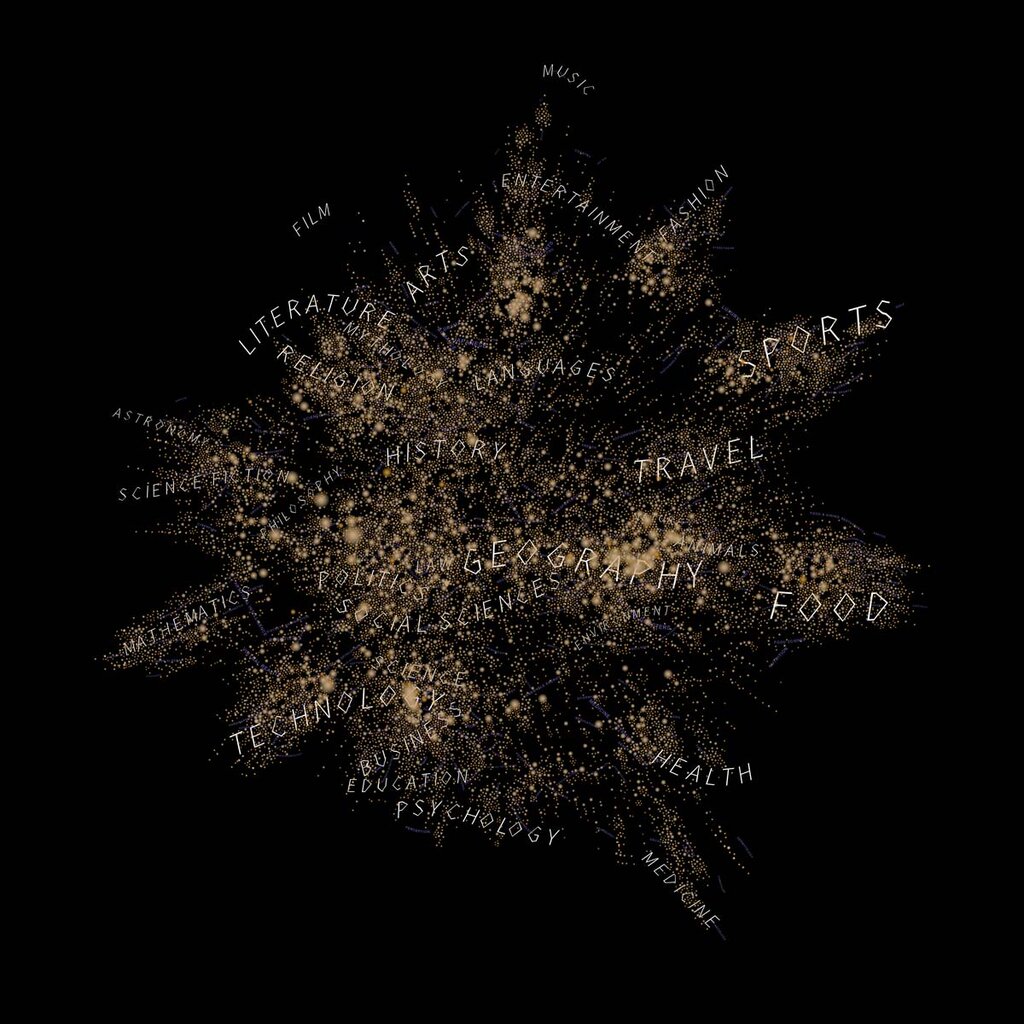
Instead of searching for a list of painters, you could ask, "Which Italian artists born in the 15th century have works displayed at The Louvre?" The graph structure allows a computer to "traverse" the connections—from The Louvre to the artworks it contains, to the artists who created them, to their nationality and birth dates—to find the answer.
This makes knowledge graphs useful in many different areas.
-
Search Engines: When you search for a celebrity, the information panel that appears with their photo, birth date, and recent movies is powered by a knowledge graph. It connects all the relevant facts about that person into a neat summary.
-
Recommendation Systems: Streaming services use knowledge graphs to recommend what to watch next. They connect you to shows watched by people with similar tastes, or to movies by the same director or starring the same actors.
-
Drug Discovery: In medicine, researchers build graphs to map the relationships between genes, proteins, and diseases. This helps them identify potential new drug targets by revealing connections that were previously hidden in siloed databases.
Knowledge graphs help us make sense of complex, interconnected data. They provide the context needed to turn raw information into useful knowledge.