Stock Chart Timings Explained
Stock Chart Timeframes
The Lens of Time
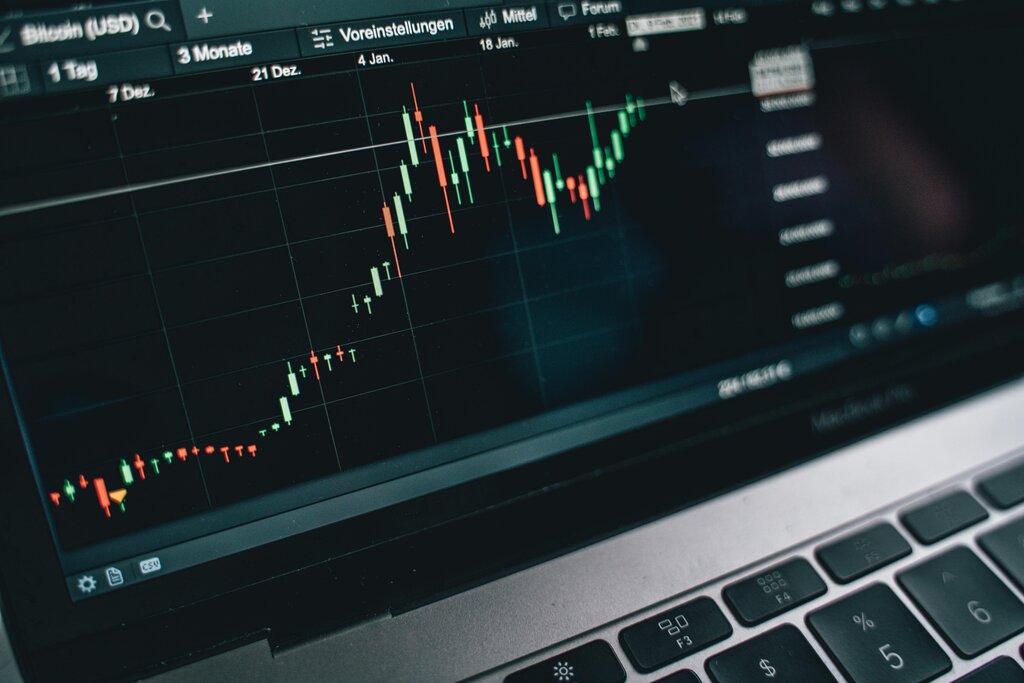
A stock chart packs a lot of information into a small space. But all that data is organized by one key element: time. Each bar or candlestick on a chart doesn't just represent a price; it represents price action over a specific period. This period is called the timeframe.
Think of it like looking at a coastline. If you zoom way out on a map, you see the general shape of the land over hundreds of miles. If you zoom in, you start to see individual bays and beaches. Zoom in further, and you can see every single wave hitting the shore. All are accurate views of the same coastline, just at different scales, or timeframes.
On a 1-minute chart, each candlestick shows all the price action that occurred within a single minute. On a daily chart, one candle represents an entire day's trading. The same underlying price movement is happening, but the chart looks radically different depending on the timeframe you choose.
Common Timeframes
Different traders focus on different timeframes based on their goals. A trader looking to make a few cents on a quick price flick will use a much shorter timeframe than an investor planning to hold a stock for years.
| Timeframe | Trader Type | Goal |
|---|---|---|
| 1-min, 5-min | Scalper, Day Trader | Profit from very small, rapid price moves. |
| 15-min, 1-hour | Day Trader | Identify and trade intraday trends. |
| 4-hour, Daily | Swing Trader | Capture trends that last several days/weeks. |
| Weekly, Monthly | Position Trader, Investor | Analyze long-term market direction. |
Shorter timeframes are considered "noisy." They show every minor price fluctuation, which can be distracting if you're trying to spot a larger trend. Longer timeframes smooth out this noise, making the primary trend much easier to see. A stock might look like it's zig-zagging wildly on a 5-minute chart, but on a weekly chart, it could be in a clear, steady uptrend.
Matching Timeframe to Strategy
The most important rule is that your choice of timeframe must match your trading strategy. There is no single "best" timeframe; there is only the one that is most suitable for your plan.
-
Scalpers need to see every tiny tick, so they live on 1-minute or 5-minute charts. Their trades may last less than a minute.
-
Day traders, who close all positions before the market closes, often use 5-minute, 15-minute, or 1-hour charts to find opportunities that will play out within a few hours.
-
Swing traders hold positions for several days or weeks to capture a significant "swing" in the price. They rely on daily and 4-hour charts to make decisions, as these timeframes show the evolution of trends that last for days.
-
Long-term investors are concerned with the big picture. By using weekly and monthly charts, they can analyze a stock's performance over years, ignoring the daily volatility that is irrelevant to their strategy.
Many experienced traders don't stick to just one timeframe. They use a technique called multiple timeframe analysis.
Traders often use multiple timeframes to get a comprehensive view of market structure.
This means using a long-term chart to identify the dominant trend, an intermediate chart to find a good entry point within that trend, and a short-term chart to fine-tune the exact moment of entry or exit. For example, a swing trader might see a strong uptrend on the weekly chart, wait for a small dip on the daily chart, and then use the 1-hour chart to buy as the price starts to recover.
What does the "timeframe" of a stock chart define?
A trader who aims to close all their positions before the end of the trading day would most likely rely on which of the following timeframes?
Choosing the right timeframe is about aligning your perspective with your trading goals. It determines the level of detail you see and helps you focus on the price movements that matter for your strategy.