Statistical Process Control for Hardware Manufacturing
Introduction to SPC
Using Data to Steer the Ship
Imagine you're mass-producing something complex, like a smartphone. Each phone needs a screen that's exactly the right thickness. Too thick, and it won't fit in the case. Too thin, and it might crack easily. How do you ensure every single screen coming off the assembly line is just right?
You can't measure every screen, but you can measure samples. Statistical Process Control (SPC) is a method that uses statistics to monitor and control a process. It’s like a quality control system that watches your production line in real-time, using data to spot problems before they lead to a mountain of defective products.
The goal of SPC is to make a process stable and predictable, so you can guarantee the quality of what you're making.
In hardware manufacturing, the stakes are high. A tiny error in a microchip can make it useless. A weak component in a car part could lead to a safety recall. SPC provides an early warning system. By collecting data on key measurements—like the thickness of a screen or the diameter of a screw—manufacturers can ensure their processes are running as they should.
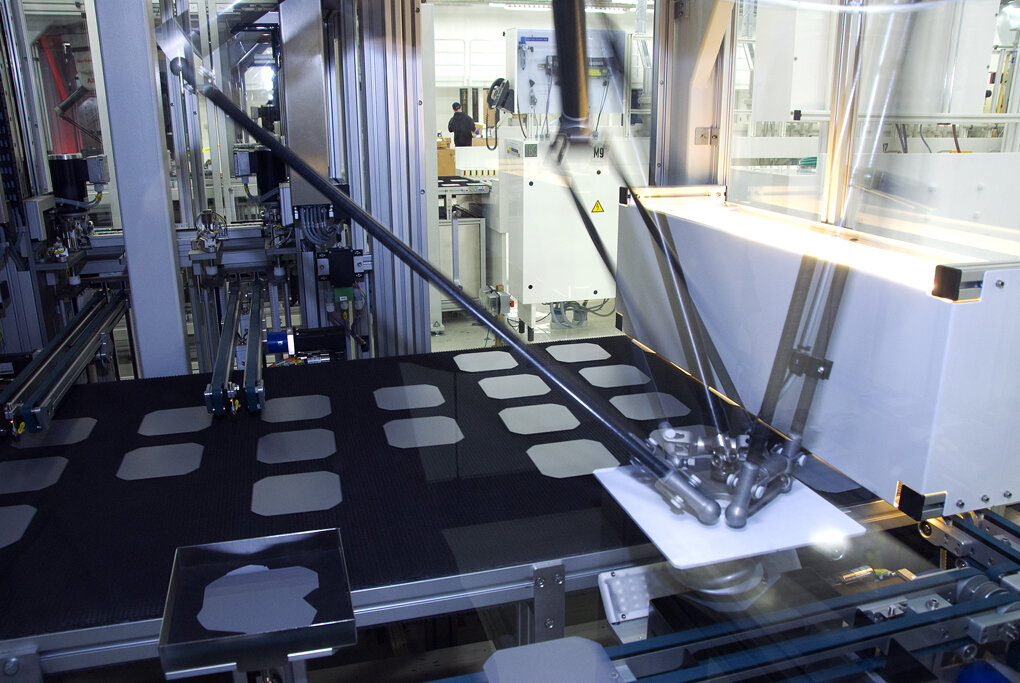
Statistical Process Control (SPC) techniques may be used to monitor the production line for consistency and quality.
All Variation Isn't Equal
No process is perfect. There will always be small variations. If you measure the thickness of 100 screens, you'll get slightly different numbers for each one. The key insight of SPC is that there are two different types of variation, and you must handle them differently.
Common Cause Variation
noun
The natural, inherent randomness in a process. It's the expected 'noise' that is always present and is predictable within a stable range.
Think about your daily commute. Some days it takes 25 minutes, other days 28. This small fluctuation is due to normal traffic patterns, the timing of traffic lights, and other routine factors. This is common cause variation. It’s part of the system. You can't eliminate it without fundamentally changing your route or mode of transport.
Special Cause Variation
noun
Unexpected variation that comes from a specific, identifiable source outside the normal process. It is unpredictable and signals that something has changed.
Now, imagine your commute suddenly takes an hour. That's not normal. You later find out there was a major accident on the highway. The accident is a special cause. It's an external event that dramatically affected the system. In manufacturing, a special cause could be a malfunctioning machine, a bad batch of raw materials, or an operator making a mistake. These are the problems you need to find and fix immediately.
Visualizing the Process
So how do you tell the two types of variation apart? You use a simple but powerful tool called a control chart. A control chart is just a graph that plots your data over time.
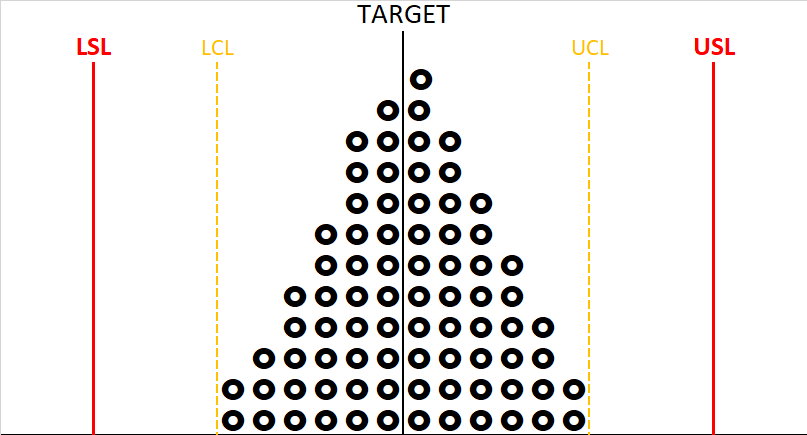
It has three key lines:
- A center line (CL): This represents the average or mean of your process data.
- An Upper Control Limit (UCL): This is the line above the average.
- A Lower Control Limit (LCL): This is the line below the average.
The control limits are calculated from the data itself. They represent the boundaries of the common cause variation. Think of them as the guardrails for your process.
As long as your data points are randomly scattered between the upper and lower control limits, your process is considered 'in control.' This means only common cause variation is present.
But if a data point falls outside the control limits, or if the points form a non-random pattern (like seven points in a row all going up), it’s a signal. The chart is telling you that a special cause of variation has likely entered the process. Now, you have a specific event to investigate and correct, keeping your production line on track and your products within specification.
What is the primary goal of Statistical Process Control (SPC) in manufacturing?
Your daily commute time typically varies by a few minutes due to normal traffic. This is an example of what?
By understanding variation and using tools like control charts, manufacturers can move from simply inspecting finished products to actively managing the quality of the process itself.