Statistical Measures Explained
Introduction to Descriptive Statistics
Making Sense of Data
Imagine you have a long list of numbers. It could be the test scores for every student in a school, the daily temperature for a year, or the price of a stock every minute of the day. Staring at that raw list doesn't tell you much. It's just a sea of data.
Descriptive statistics are the tools we use to turn that sea of data into a simple, understandable story. They help us summarize and describe the main features of a dataset without getting lost in the details.
The goal is simple: take a large amount of information and boil it down to a few meaningful numbers or visuals.
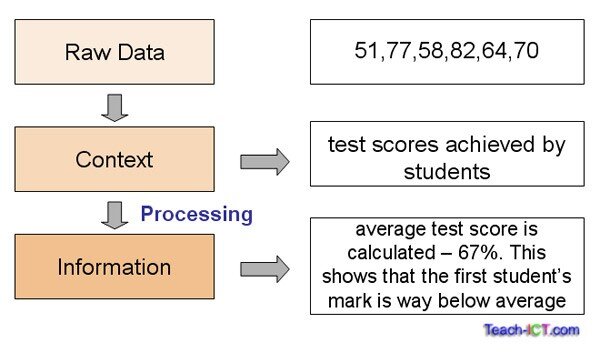
Think of it like describing a person. You wouldn't list every single detail. Instead, you'd give a summary: their height, hair color, and general build. Descriptive statistics do the same for data, providing a high-level summary that's easy to grasp. This first look at the data is a crucial step in any analysis, helping to spot patterns, identify unusual points, and prepare for more complex analysis later on.
Finding the Center
One of the first things we want to know about a dataset is its 'typical' value. Where's the center? This is what measures of central tendency tell us. They give us a single value that represents the middle or center of the data.
You've likely heard of the big three:
- Mean: The familiar average.
- Median: The value smack in the middle of the dataset when it's ordered from smallest to largest.
- Mode: The value that shows up most often.
Each one gives a slightly different idea of what's 'typical' in the data. Choosing the right one depends on what you're trying to understand about your dataset.
Measuring the Spread
Knowing the center is useful, but it doesn't tell the whole story. Imagine two cities where the average daily temperature is 15°C. In one city, the temperature is always between 12°C and 18°C. In the other, it swings wildly from 0°C to 30°C. The average is the same, but the experience of living there is completely different.
This is where measures of variability (also called measures of dispersion or spread) come in. They describe how spread out or clustered together the data points are.
Just like with central tendency, there are several ways to measure variability, including the range (the difference between the highest and lowest values) and standard deviation (a measure of how far each point is from the average).
Together, measures of central tendency and variability provide a powerful snapshot of your data. They are the fundamental building blocks of statistical analysis, giving you the context needed to explore your data more deeply.
What is the primary goal of descriptive statistics?
A real estate agent is summarizing home prices in a neighborhood. The prices are mostly between 500,000, but one mansion just sold for $5,000,000. Which measure of central tendency would give the most realistic 'typical' home price?