Statistical Analysis with R or Python for Thesis
Introduction to R and Python
Your Tools for Data Analysis
Welcome to the world of data analysis. Two of the most powerful and popular tools you'll encounter are the programming languages R and Python. Both are free, open-source, and supported by massive communities of developers and data scientists. They can handle nearly any statistical task you can think of, from cleaning messy data to building complex machine learning models.
R and Python dominate the world of statistical analysis – these two programming languages are powerful tools that offer a range of functionalities, but they come with specific advantages for different kinds of statistical modeling tasks.
You don't need to master both right away. Many people pick one and stick with it. Others use both, leveraging each for its unique strengths. R is often favored in academia and research for its vast ecosystem of statistical packages. Python, with its simple syntax and versatility, is a favorite in the tech industry and for machine learning applications. We'll get you set up with both so you can explore which one feels right for you.
Setting Up R and RStudio
Let's start with R. First, you need to install the R language itself. You can download it from the Comprehensive R Archive Network (CRAN). Think of this as installing the engine of a car.
Once R is installed, you'll want a more user-friendly way to interact with it. That's where RStudio comes in. RStudio is an Integrated Development Environment, or IDE. It’s like the dashboard of your car, giving you a console to run commands, a text editor to write scripts, and windows to view plots, files, and variables all in one place.
We strongly encourage using RStudio as the integrated development environment (IDE) in the first individual steps of preparing simple R scripts [https://posit.co/download/rstudio-desktop].
After installing both, you can open RStudio to start working. Let's try some basic operations. In R, the assignment operator is <-, which looks like an arrow. It's used to store values in variables.
# Assigning variables in R
x <- 10
y <- 5

# Performing a simple calculation
z <- x + y

# Print the result to the console
print(z)
The power of R is extended through packages, which are collections of functions and data bundled together. Two essential packages for data analysis are dplyr for data manipulation and ggplot2 for data visualization. dplyr provides a set of verbs like filter() and select() that make it intuitive to work with data frames. ggplot2 is a powerful library for creating elegant and complex graphics, though we'll just be introducing it for now.
Setting Up Python and Jupyter
Next up is Python. Python is celebrated for its readability and clean syntax, making it a great language for beginners.
Python has gained immense popularity in data science and statistics due to its simplicity, readability, and extensive library support.
The easiest way to get started with Python for data science is to install the Anaconda Distribution. This single download includes Python, a package manager, and hundreds of popular data science libraries, saving you the hassle of installing them one by one.
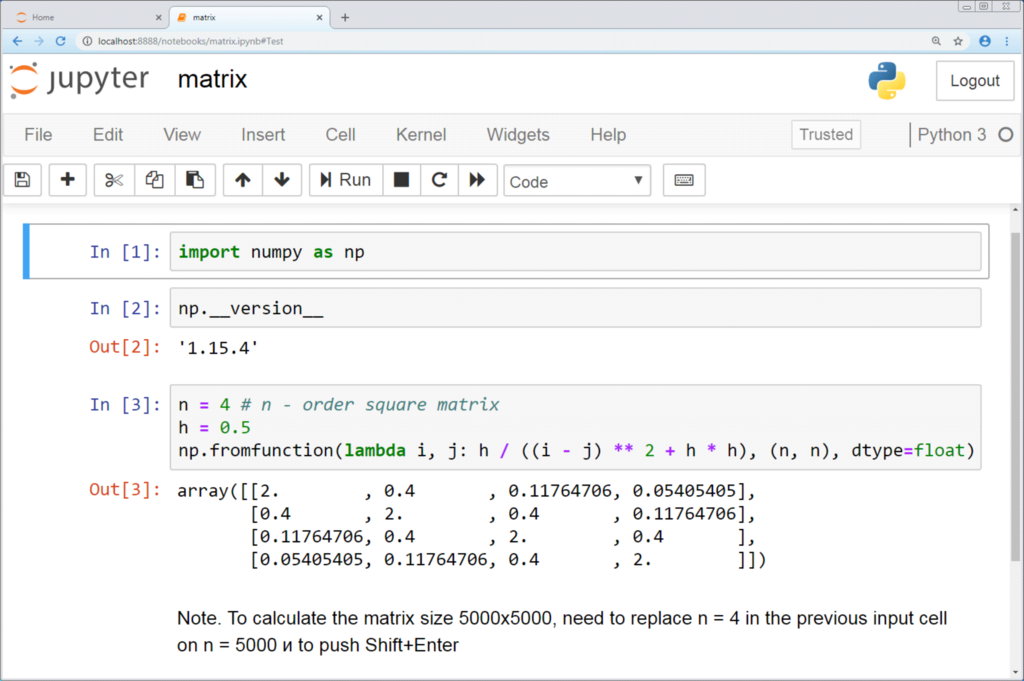
Included with Anaconda is Jupyter Notebook, an interactive, web-based tool that lets you write and run code, add explanatory text, and see your results in one place. It's incredibly useful for exploratory data analysis.
In Python, you use the equals sign (=) to assign variables.
# Assigning variables in Python
x = 10
y = 5

# Performing a simple calculation
z = x + y

# Print the result
print(z)
Like R, Python's strength comes from its libraries. For data analysis, three are fundamental:
- NumPy is the base for numerical computing, providing powerful array objects.
- pandas is built on NumPy and offers data structures, like the DataFrame, which are perfect for handling tabular data.
- Matplotlib is the primary library for creating plots and visualizations.
Core Libraries at a Glance
Both ecosystems have tools for the same core tasks: manipulating data and visualizing it. The names are different, but the goals are often the same. Here's a quick comparison of the key libraries for getting started.
| Task | R Library | Python Library |
|---|---|---|
| Data Manipulation | dplyr | pandas |
| Numerical Operations | (Built-in) | numpy |
| Data Visualization | ggplot2 | matplotlib |
Let's see how you might create a simple table of data, called a data frame, in each language. In R, you can use the data.frame() function.
# R code to create a data frame
my_data_r <- data.frame(
  Name = c("Alice", "Bob", "Charlie"),
  Age = c(25, 30, 35)
)

print(my_data_r)
In Python, you'd use the pandas library to create a very similar structure called a DataFrame.
# Python code to create a DataFrame
import pandas as pd

data = {'Name': ["Alice", "Bob", "Charlie"],
        'Age': [25, 30, 35]}

my_data_py = pd.DataFrame(data)

print(my_data_py)
As you can see, the syntax differs, but the result is a clean, organized table of data in both languages. You now have the basic setup for both R and Python. The next step is to start using them to explore and analyze data.
Time to check your understanding of these foundational tools.
Which statement best describes the typical domains where R and Python are favored in data science?
A friend wants to start using R and asks for your advice on what to install. Which of the following best describes the relationship between R and RStudio?
With your environments set up, you're ready to tackle real data analysis. The journey starts with these first steps into R and Python.