Statistical Analysis with R or Python for Thesis
Introduction to R and Python
Getting Started with R
First, let's get you set up with R. R is a programming language built specifically for statistical computing and graphics. To use it effectively, you'll also want RStudio. Think of R as the engine of a car and RStudio as the dashboard, steering wheel, and pedals. R does the work, but RStudio makes it much easier to control.
Your first step is to install both. You must install R first, and then install RStudio Desktop. Both are free and have versions for all major operating systems.
Once you have RStudio open, you'll see a console where you can type commands. Let's start with the most basic operation: creating a variable. In R, the assignment operator is <-, which looks like an arrow.
# In R, we use <- to assign a value to a variable
my_number <- 10

# To see what's in the variable, just type its name
my_number
R has several fundamental data structures. The simplest is a vector, which is a sequence of elements of the same type. A more complex and useful structure is a data frame, which is a table with rows and columns, similar to a spreadsheet. Data frames are the most common way you'll work with datasets in R.
# A vector of numbers
ages <- c(25, 30, 22, 45)

# A data frame with names and ages
people <- data.frame(
  name = c("Alice", "Bob", "Charlie", "David"),
  age = ages
)

# Print the data frame
people
The real power of R comes from its packages, or libraries. These are collections of functions and data that extend R's capabilities. For data analysis, two are essential:
- dplyr: A library that makes data manipulation intuitive. You can use it to filter rows, select columns, and summarize data.
- ggplot2: A library for creating elegant and complex data visualizations.
You'll need to install packages once, but you must load them with the library() function in every new R session you start.
# Install the packages (you only need to do this once)
install.packages("dplyr")
install.packages("ggplot2")

# Load the packages for use in your current session
library(dplyr)
library(ggplot2)
Diving into Python
Next up is Python. Python is a general-purpose programming language, but it has become a powerhouse for data science thanks to its extensive collection of libraries. A popular way to work with Python for data analysis is through a Jupyter Notebook. This tool lets you write and run code in individual cells, making it easy to experiment and see your results immediately.
The easiest way to get Python and Jupyter Notebook is by installing the Anaconda Distribution. It's a free package that includes Python, Jupyter, and hundreds of popular data science libraries right out of the box.
In Python, assigning a variable is straightforward. You use the equals sign =.
# In Python, we use = to assign a value to a variable
my_number = 10

# To see the output, we use the print() function
print(my_number)
Python's basic data structures include lists (ordered collections of items) and dictionaries (collections of key-value pairs). While useful, for data analysis you'll almost always use a structure from a library called pandas: the DataFrame. Just like in R, a pandas DataFrame is a two-dimensional table with labeled rows and columns.
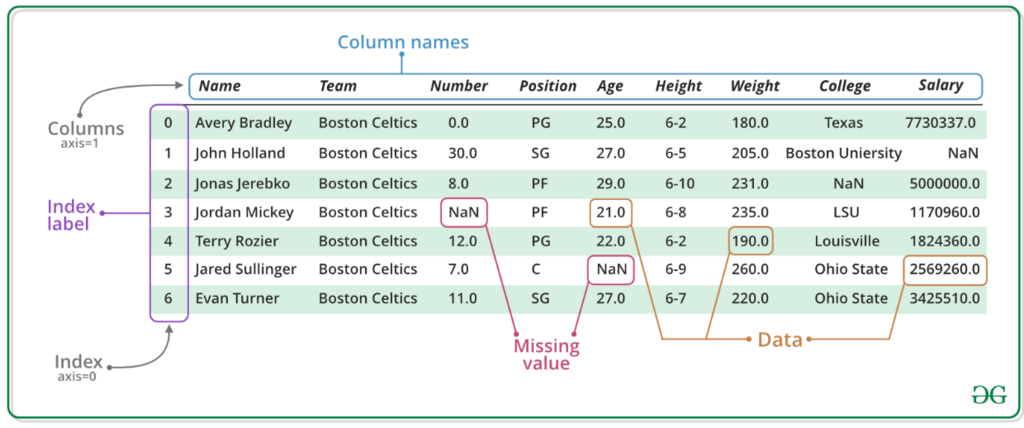
Let's introduce the core Python libraries for data science:
- pandas: The essential library for data manipulation. It provides the DataFrame, the primary tool for holding and working with your data.
- numpy: A fundamental package for numerical computing. It's the foundation for many other libraries and is especially good at handling large arrays of numbers efficiently.
- matplotlib: The most widely used library for creating plots and charts in Python.
In Python, you load libraries using the import statement. It's a common convention to give pandas and numpy shorter aliases, like pd and np, to make your code cleaner.
# Import libraries and give them common aliases
import pandas as pd
import numpy as np
import matplotlib.pyplot as plt

# Create a dictionary of data
data = {
    'name': ['Alice', 'Bob', 'Charlie', 'David'],
    'age': [25, 30, 22, 45]
}

# Create a pandas DataFrame from the dictionary
people_df = pd.DataFrame(data)

# Print the DataFrame
print(people_df)
Now that you've seen the basics of setting up both R and Python, let's test your knowledge.
What is the primary role of RStudio in relation to R?
Which command is used to load an already-installed package like ggplot2 into your current R session?
With these foundations, you're ready to start loading, cleaning, and analyzing data in your language of choice.