Statistical Analysis with R or Python for Thesis
Introduction to R and Python
Your First Steps into R and Python
Welcome to the world of data analysis. Two of the most powerful tools at your disposal are the programming languages R and Python. While both can wrangle data, perform statistical analysis, and create visualizations, they come from different backgrounds and have distinct strengths.
R was built by statisticians, for statisticians. Its environment is tailored for statistical exploration and data modeling. Python, on the other hand, is a general-purpose language that has become a data science powerhouse thanks to a rich ecosystem of libraries. Think of R as a specialized workshop for statistics, while Python is a massive, adaptable factory that can be tooled for any job, including statistics.
Getting Started with R
To begin with R, you'll need two things: the R language itself and RStudio. First, you need to install R, which is the underlying engine. After that, you'll install RStudio. RStudio is an Integrated Development Environment, or IDE. It's a workbench that makes using R much easier, with tools for writing code, viewing plots, and managing your projects all in one place.
First, download and install R from the Comprehensive R Archive Network (CRAN). Then, download and install the free version of RStudio Desktop.
Once you have RStudio open, you'll see a console where you can type commands. Let's try some basic operations. In R, the primary way to assign a value to a variable is with the arrow operator, <-.
# Assign the value 10 to the variable x
x <- 10

# Perform a simple calculation
y <- x * 5

# Print the value of y
y

# Create a list of numbers (called a vector in R)
my_vector <- c(2, 4, 6, 8)

# Display the vector
my_vector
Setting Up Your Python Environment
Python is celebrated for its clean syntax and versatility. For data analysis, the most common setup involves Python and Jupyter Notebook. A Jupyter Notebook allows you to write and run code in segments, mix it with text and images, and see your outputs immediately. It's like an interactive lab notebook for your code.
The easiest way to get both Python and Jupyter Notebook is by installing the Anaconda Distribution. It's a free package that comes with Python, Jupyter, and hundreds of popular data science libraries pre-installed.
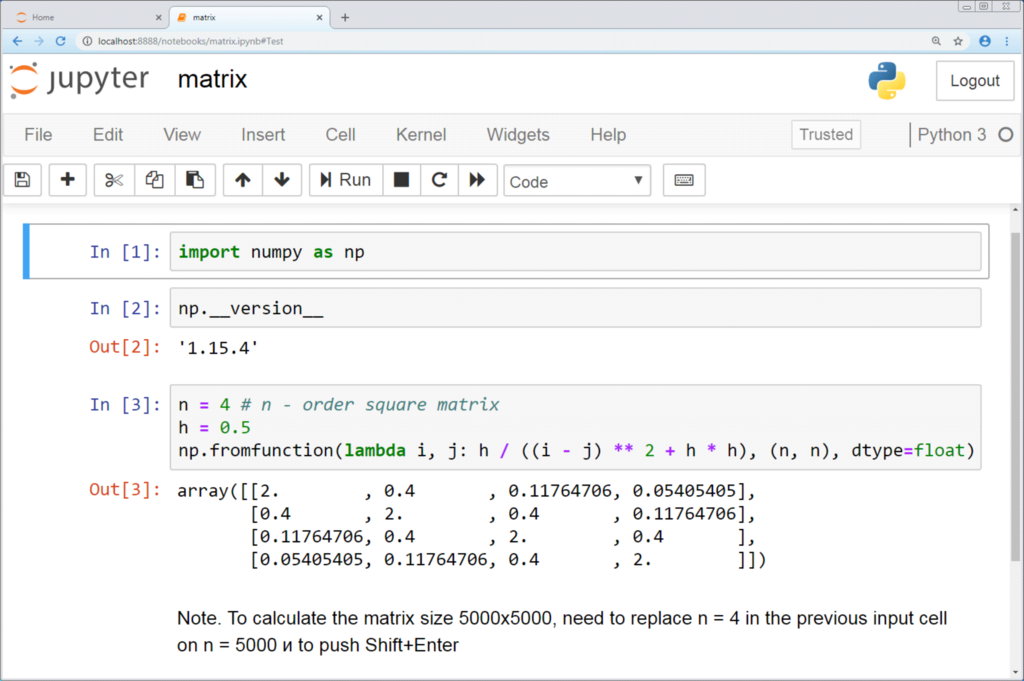
After installing Anaconda, you can launch a Jupyter Notebook from the Anaconda Navigator. It will open in your web browser. Let's see how the same basic operations look in Python. In Python, you use the equals sign, =, for variable assignment.
# Assign the value 10 to the variable x
x = 10

# Perform a simple calculation
y = x * 5

# Print the value of y
print(y)

# Create a list of numbers
my_list = [2, 4, 6, 8]

# Display the list
print(my_list)
Notice the small differences in syntax. R uses <- and the c() function to create a vector of numbers, while Python uses = and square brackets [] to create a list. These fundamentals are your entry point into using both languages for data analysis.
Time to check your understanding of these first steps.
Which statement best describes the fundamental difference between R and Python in the context of data analysis?
To get started with R, you typically need to install the R language itself and what other piece of software?
With your environments set up, you are now ready to start exploring, manipulating, and analyzing data.