Statistical Analysis with R or Python for Thesis
Introduction to R and Python
Your Programming Toolkit
When it comes to statistical analysis, two programming languages stand out: R and Python. Think of them as two different kinds of workshops. R is a specialized shop built from the ground up for statistics and data visualization. Python is a general-purpose workshop that, with the right tools, becomes an incredibly powerful environment for data science and more.
Both are free, open-source, and supported by massive communities. You don't need to master both, but understanding the basics of each will help you choose the right tool for the job. We'll walk through setting up your workspace for both and introduce the essential starter tools, known as libraries, that make them so effective for handling data.
Setting Up Your Environment
Before you can write code, you need a place to write it. An Integrated Development Environment, or IDE, is a software application that makes programming easier. It's like a workbench that combines a text editor, a debugger, and other helpful tools in one place.
For R, the standard setup is to install two things: R itself, which is the programming language, and RStudio, which is the IDE. RStudio provides a clean, organized interface with panels for your code, the results, your files, and plots. You can download both from their respective official websites.
For Python, a popular choice for data science is the Anaconda distribution. Anaconda bundles Python with hundreds of the most common data science libraries and tools, including an IDE called Spyder and the very popular Jupyter Notebook. Jupyter Notebooks are particularly useful because they let you mix live code, text, and visualizations in a single document, which is great for exploring data.
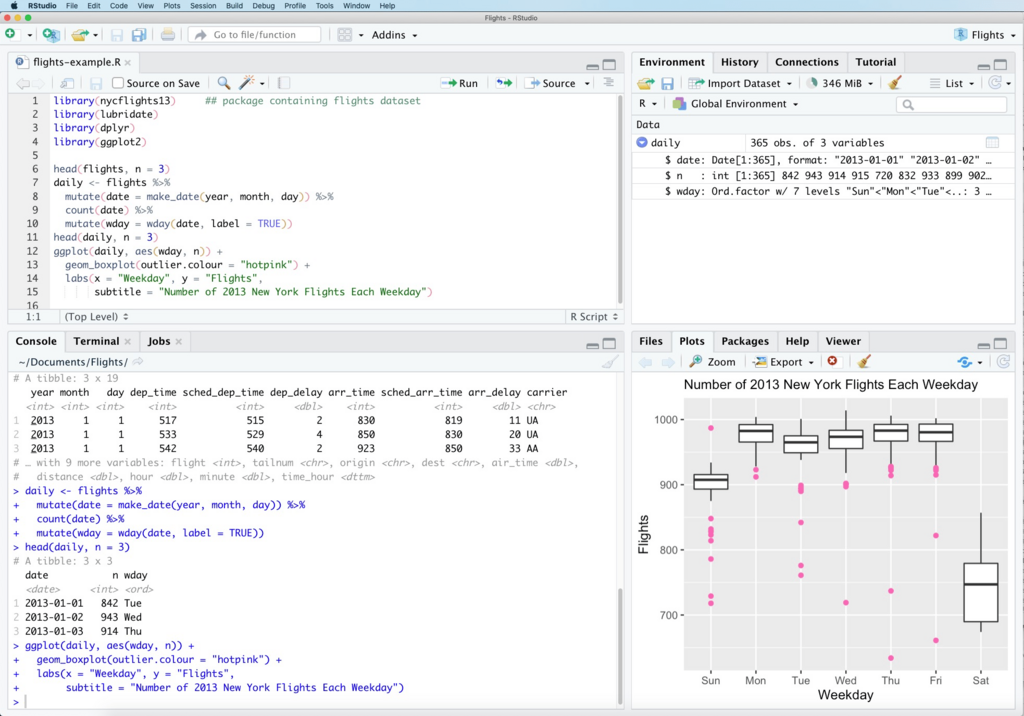
The Building Blocks in R
R has a straightforward syntax for statistical tasks. You assign values to variables using an arrow <-. For example, x <- 5 assigns the value 5 to the variable x.
While base R is powerful, its true strength comes from its ecosystem of packages, or libraries. To get started with data manipulation and visualization, you'll want to install a collection of packages called the tidyverse. This includes two key players:
- dplyr: A library for data manipulation. It provides simple verbs like
filter(),select(), andmutate()that make cleaning and organizing your data intuitive. - ggplot2: A library for creating graphics. It's based on a concept called the "grammar of graphics," allowing you to build complex plots layer by layer.
To use these, you first need to install them and then load them into your R session.
# Install the collection of packages (only need to do this once)
install.packages("tidyverse")

# Load the libraries for use in your current session
library(dplyr)
library(ggplot2)
Once loaded, you can use their functions to work with your data efficiently.
Python's Power Tools
Python is known for its readability and simple syntax. You assign variables with an equals sign =. For example, x = 5.
Like R, Python's utility for data analysis comes from its libraries. If you installed Anaconda, you already have these. If not, you can install them using Python's package installer, pip. The three fundamental libraries are:
- pandas: The go-to library for data manipulation. It introduces a powerful data structure called the DataFrame, which is essentially a table like a spreadsheet, but with much more functionality.
- NumPy: Short for Numerical Python, this library is the backbone for numerical operations. It provides efficient arrays and mathematical functions, making calculations on large datasets fast.
- Matplotlib: The original and most widely used plotting library for Python. It gives you fine-grained control over every aspect of your figures.
If you want to learn Python for data science, you might want to focus on libraries like pandas, numpy, and matplotlib.
Here's how you would install these libraries using pip from your terminal or command prompt.
# Install pandas, NumPy, and Matplotlib using pip
pip install pandas numpy matplotlib
After installing, you import them into your Python script to start using them.
# Import libraries into your Python script
import pandas as pd
import numpy as np
import matplotlib.pyplot as plt

# The 'as pd' part creates a shorter alias to type.
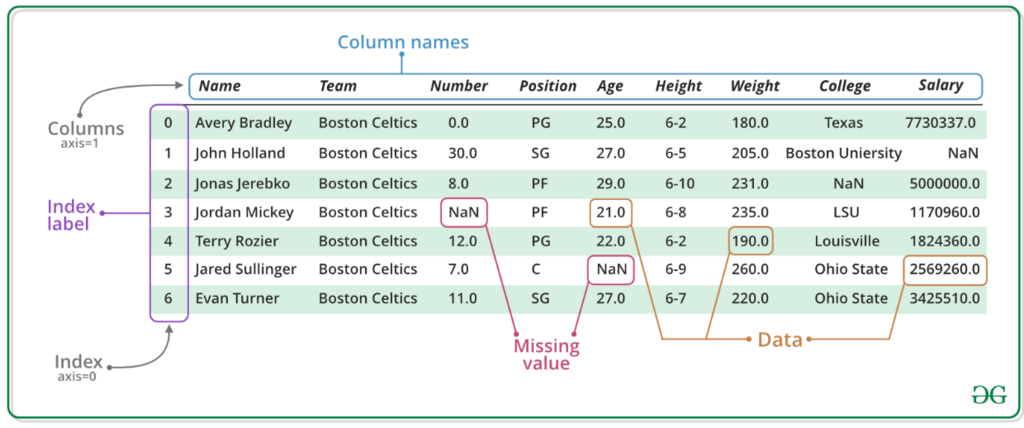
With your environment set up and a basic understanding of the core libraries in R and Python, you're ready to start importing and working with data. These tools are the foundation for nearly all statistical analysis you'll perform.