Statistical Analysis for Thesis with R or Python
Introduction to R and Python
Setting Up Your Tools
R and Python are two of the most popular languages for working with data. R was built by statisticians specifically for statistical analysis. Python is a general-purpose language that has become a powerhouse for data science thanks to its powerful libraries. You can't go wrong with either, and many data professionals know both.
R and Python dominate the world of statistical analysis – these two programming languages are powerful tools that offer a range of functionalities, but they come with specific advantages for different kinds of statistical modeling tasks.
First, let's get R set up. You'll need two things: R itself, and an application called RStudio. R is the underlying programming language, and RStudio is an integrated development environment (IDE) that makes writing R code much easier. Always install R first, then install RStudio. You can find both online with a quick search for "download R" and "download RStudio Desktop."
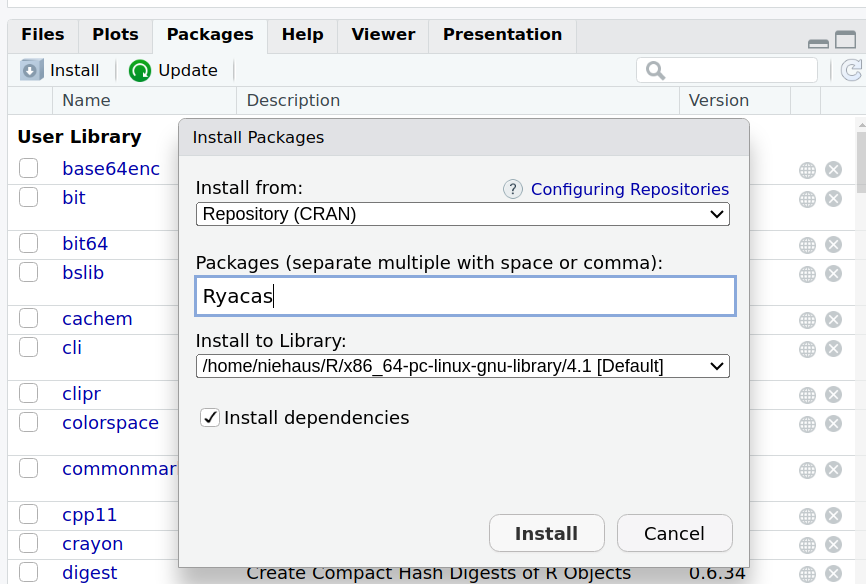
For Python, the easiest way to get started is by installing the Anaconda Distribution. This single download includes Python, Jupyter Notebook (a popular tool for writing and running Python code), and hundreds of essential data science libraries. This saves you the trouble of installing them all individually. Search for "download Anaconda Distribution" and choose the latest Python version.
Your First Steps in R
Once you have RStudio open, you'll see a console where you can type commands. R's syntax is a little unique. For example, the standard way to assign a value to a variable is with an arrow, <-.
# Assign the value 10 to a variable named 'x'
x <- 10

# Print the value of x
x
You can perform basic math just like you would on a calculator.
5 + 3
10 / 2
A core concept in R is the vector. A vector is a sequence of data elements of the same basic type. You can create one using the c() function, which stands for "combine."
# Create a vector of numbers
my_grades <- c(85, 92, 78, 95)

# Find the average of the grades
mean(my_grades)
Notice how we used the built-in mean() function to get the average. R comes with many functions like this ready to go for statistical tasks.
A Quick Start with Python
Now let's switch to Python. You'll typically write and run your code in a Jupyter Notebook, which lets you mix code, text, and outputs in a single document. Variable assignment in Python is more straightforward, using the equals sign =.
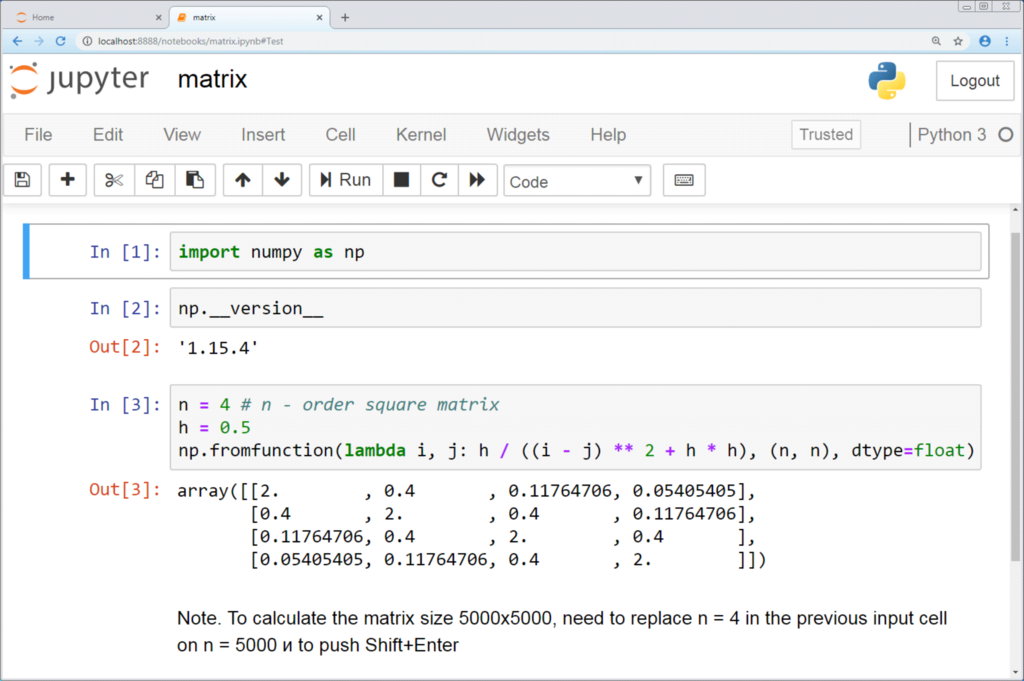
Let's perform the same basic operations we did in R.
# Assign the value 10 to a variable named 'x'
x = 10

# Print the value of x
print(x)
The equivalent of an R vector in basic Python is a list, which you create with square brackets [].
# Create a list of numbers
my_grades = [85, 92, 78, 95]
Unlike R, Python's standard library doesn't have a simple mean() function. To do statistical calculations, you almost always use external libraries. The most common one for numerical operations is NumPy. First you import the library, then you can use its functions.
# Import the numpy library
import numpy as np

# Find the average of the grades using numpy's mean function
np.mean(my_grades)
This difference is key: R is built for statistics out of the box, while Python relies on a rich ecosystem of specialized libraries to become a data analysis powerhouse.
Now that you have your tools installed and have written your first few lines of code, let's test your understanding.
When setting up R for data analysis, what is the correct installation order for the required software?
According to the text, what is the recommended way for a beginner to set up Python for data science?
You've successfully set up your environments for both R and Python and executed some basic commands. This foundation is the first step toward performing powerful statistical analysis.