Statistical Analysis for Thesis with R or Python
Introduction to R and Python
Your Toolkit for Data Analysis
R and Python are the two most popular programming languages for statistics and data analysis. Think of them as two different kinds of powerful toolkits. R was built by statisticians, specifically for statistical work. Python is a general-purpose language that happens to have incredibly powerful tools for data science, making it a versatile choice.
R and Python dominate the world of statistical analysis – these two programming languages are powerful tools that offer a range of functionalities, but they come with specific advantages for different kinds of statistical modeling tasks.
You don't need to master both right away. Many people pick one and stick with it. We'll walk through getting started with each, so you can see how they work.
Setting Up R and RStudio
First, you need the R language itself. You can download it for free from the Comprehensive R Archive Network (CRAN). But writing code directly in R's basic console is like trying to build furniture with only a screwdriver. It works, but it's not efficient.
That's where RStudio comes in. RStudio is an Integrated Development Environment (IDE) for R. It's a workbench that organizes your code, plots, and results in one clean interface. It makes programming in R much more manageable and intuitive.
Always use RStudio when writing R code. It provides helpful features like code completion, debugging tools, and easy package management that will save you a lot of time and frustration.
Once you have R and RStudio installed, you can start writing code. The basic syntax is straightforward. You can assign values to variables using the <- operator. For example, let's store a number and perform a simple calculation.
# Assign the value 10 to a variable named 'x'
x <- 10

# Assign the value 5 to a variable named 'y'
y <- 5

# Add them together and store in a new variable 'z'
z <- x + y

# Print the result
print(z)
One of the most fundamental data structures in R is the vector. A vector is a sequence of data elements of the same type. You can create one using the c() function, which stands for "combine."
# Create a numeric vector
my_numbers <- c(1, 2, 3, 5, 8)

# Create a character vector (a vector of text)
my_fruits <- c("apple", "banana", "cherry")
Setting Up Python and Jupyter
Python is celebrated for its clean, readable syntax. While it wasn't designed just for statistics, its powerful libraries like NumPy, Pandas, and Matplotlib have made it a go-to for data scientists.
To get started, the easiest path is to install the Anaconda Distribution. This package includes Python, a host of essential data science libraries, and Jupyter Notebook. A Jupyter Notebook is an interactive environment that lets you write and run code in chunks, see the output immediately, and mix code with text and visualizations. It's perfect for exploring data.
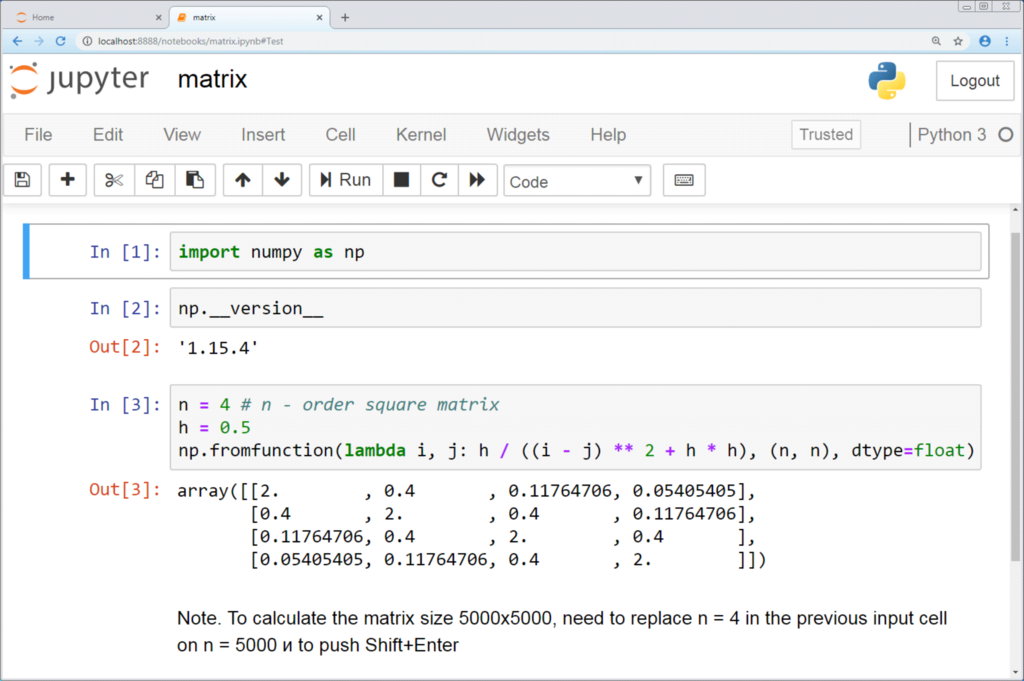
Python's syntax for assigning variables is simple, using the = sign. The logic is very similar to R's.
# Assign the value 10 to a variable named 'x'
x = 10

# Assign the value 5 to a variable named 'y'
y = 5

# Add them together and store in a new variable 'z'
z = x + y

# Print the result
print(z)
The most common data structure in Python for storing a sequence of items is the list. A list is similar to an R vector but is more flexible, as it can hold elements of different data types. You create a list using square brackets [].
# Create a list of numbers
my_numbers = [1, 2, 3, 5, 8]

# Create a list with mixed data types
mixed_list = [1, "apple", 3.14]
Now that you've seen the basics of setting up both environments, let's review the key terms.
Ready to check your understanding?
Which statement best describes the primary difference between R and Python for data analysis?
In R, the c() function is used to create a fundamental data structure called a _______, which is a sequence of data elements of the same type.
With your environment set up and a basic grasp of the syntax, you're ready to start working with actual data.