Statistical Analysis for Thesis with R or Python
Introduction to R and Python
Meet the Languages
In the world of data analysis, two languages stand out: R and Python. They are both powerful, free, and widely used, but they come from different places and have different strengths.
Think of them as two different kinds of workshops. One is a specialized woodshop with every chisel and saw perfectly designed for woodworking (that's R). The other is a general-purpose workshop with excellent tools for wood, metal, and electronics, making it incredibly versatile (that's Python).
R was built by statisticians, for statisticians. It excels at statistical modeling, data exploration, and creating beautiful, complex data visualizations. Its ecosystem is filled with packages designed for specific academic and research tasks. If your primary goal is deep statistical analysis and reporting, R is a fantastic choice.
Python, on the other hand, is a general-purpose programming language that has become a data science powerhouse. It's known for its clean, readable syntax. While it wasn't originally built for statistics, powerful libraries have made it a top contender. If your data analysis project needs to be integrated into a larger application or you're working with machine learning and big data, Python often has the edge.
Setting Up Your Workspace
Before you can start analyzing data, you need to set up your environment for each language. This is like getting your workshop organized before starting a project.
For R, the standard setup is to install R itself (the engine) and then install RStudio. RStudio is an Integrated Development Environment (IDE) that makes working with R much easier. It gives you a code editor, a console to run commands, a place to view your plots, and tools to manage your projects all in one window.
For Python, a popular choice is the Anaconda distribution. It bundles Python with many of the most important data science libraries and tools, including Jupyter Notebooks. Jupyter is an interactive environment that lets you write and run code in blocks, mixing it with text and visualizations. It's great for exploratory work.
Basic Building Blocks
Both languages have ways to store information in variables and organize it into different structures. The syntax looks a little different, but the core ideas are similar.
In R, you typically assign a value to a variable using the <- operator. The most basic data structure is a vector, which holds a sequence of values of the same type.
# R Code
# Assigning a value to a variable
my_number <- 10

# Creating a vector of numbers
ages <- c(25, 30, 22, 45)

# Creating a vector of text
names <- c("Alice", "Bob", "Charlie")
In Python, you use the = sign for assignment. The most common basic data structure is a list, which is flexible and can hold values of different types.
# Python Code
# Assigning a value to a variable
my_number = 10

# Creating a list of numbers
ages = [25, 30, 22, 45]

# Creating a list of text
names = ["Alice", "Bob", "Charlie"]
Your Data Analysis Toolkit
While the basic languages are powerful, their true strength for data analysis comes from specialized libraries, or packages, that add new functions and data structures.
In R, the tidyverse is a collection of packages that work together to make data science intuitive and efficient. A core part of the tidyverse is dplyr for data manipulation and the concept of a data frame, a table-like structure for holding your data.
# R code using the tidyverse
library(dplyr)

# Create a simple data frame
people <- data.frame(
  name = c("Alice", "Bob", "Charlie"),
  age = c(25, 30, 22)
)

# Get a subset of the data
# Here, we filter for people older than 24
older_people <- filter(people, age > 24)
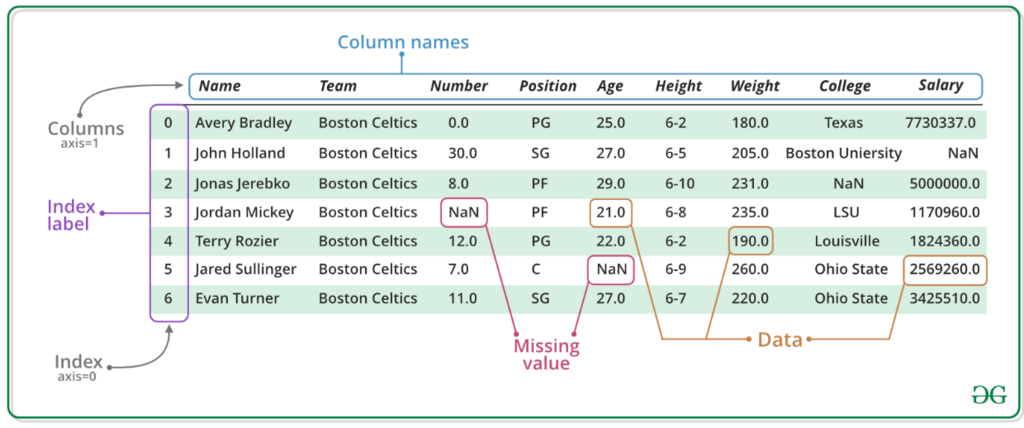
In Python, the essential libraries are NumPy for numerical operations and Pandas for data manipulation. NumPy introduces the powerful array object for fast mathematical computations. Pandas introduces the DataFrame, which is heavily inspired by R's data frame.
# Python code using pandas and numpy
import pandas as pd
import numpy as np

# Create a Pandas DataFrame
data = {'name': ['Alice', 'Bob', 'Charlie'],
        'age': [25, 30, 22]}
people = pd.DataFrame(data)

# Get a subset of the data
# This also selects people older than 24
older_people = people[people['age'] > 24]

# Using NumPy to create an array
num_array = np.array([1, 2, 3, 4])
# Perform a math operation on the whole array
print(num_array * 2)
Both the tidyverse in R and Pandas in Python provide a clear, readable grammar for performing the most common data wrangling tasks, such as filtering, selecting, and transforming data. Getting comfortable with these tools is the first major step toward mastering data analysis in either language.
Time to check your understanding of these foundational concepts.
Which statement best describes the primary design philosophy difference between R and Python for data analysis?
In R, what is the conventional operator used for assigning a value to a variable?
With these basics in place, you're ready to start loading, cleaning, and exploring data in either R or Python.