Statistical Analysis for Thesis with R or Python
Introduction to R and Python
Getting Started with R and Python
R and Python are two of the most popular programming languages for statistical analysis and data science. Think of them as two different toolboxes for working with data. R was built by statisticians, so its language and tools are highly specialized for data analysis. Python is a general-purpose language that has become a powerhouse for data science thanks to a collection of powerful community-built libraries.
Choosing between them often comes down to personal preference or what a specific industry uses. For now, let's get a feel for both. We'll focus on the absolute basics: setting up your workspace, understanding the syntax, and meeting the most essential tools for handling data.
Setting Up Your Environment
Before you can write code, you need a place to write it. An Integrated Development Environment (IDE) is a software application that makes programming easier. It's like a specialized workshop that combines a text editor, tools for running your code, and ways to see your variables and plots all in one place.
For R, the standard choice is RStudio. It's designed specifically for R and provides an intuitive interface for managing your code, data, and visualizations.
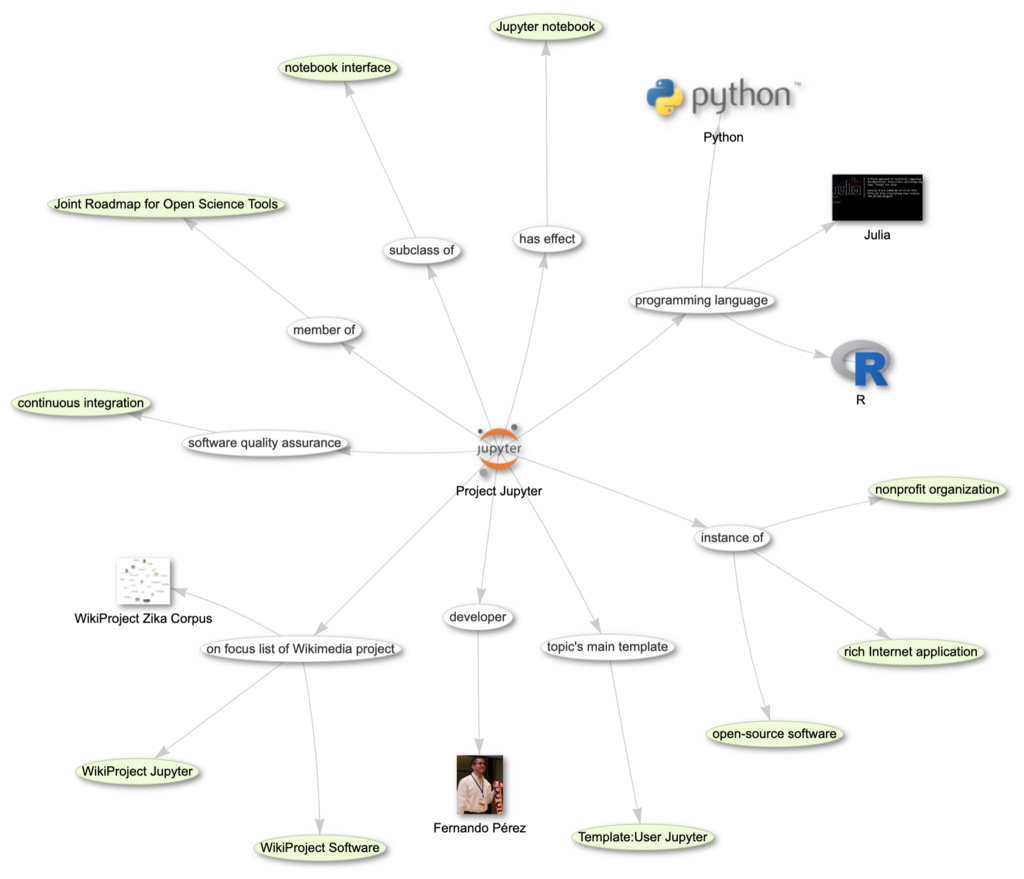
For Python, a common setup is installing Anaconda. This distribution bundles Python with many essential data science libraries and includes Jupyter Notebook, an interactive, web-based IDE. Jupyter is great for mixing code, text, and visualizations in a single document, making it perfect for exploratory analysis.
A Quick Look at R
R's syntax can feel a bit quirky at first, but it's incredibly powerful for statistics. Data is often stored in a data.frame, which is R's version of a spreadsheet or table with rows and columns.
To handle data frames effectively, the R community relies heavily on a collection of packages called the
tidyverse. We'll look at two of its core components:dplyrfor data manipulation andggplot2for visualization.
dplyr provides simple verbs to solve common data problems. For example, you can filter() rows, select() columns, and mutate() to create new columns. These verbs are often chained together using the pipe operator, %>%.
# Load the dplyr library
library(dplyr)

# Imagine we have a data frame called 'sales'
# This code filters for sales in the 'North' region
# and selects only the 'product' and 'revenue' columns.

north_sales <- sales %>%
  filter(region == "North") %>%
  select(product, revenue)
ggplot2 is a library for creating graphics. It uses a "grammar of graphics" approach, where you build plots layer by layer. You start with your data, map variables to aesthetics (like x-axis, y-axis, and color), and then add geometric shapes (like points, lines, or bars).
A Tour of Python
Python is known for its readable and clean syntax. While it's a general-purpose language, the pandas library has made it a go-to for data analysis. The core data structure in pandas is the DataFrame, which is very similar to R's data.frame.
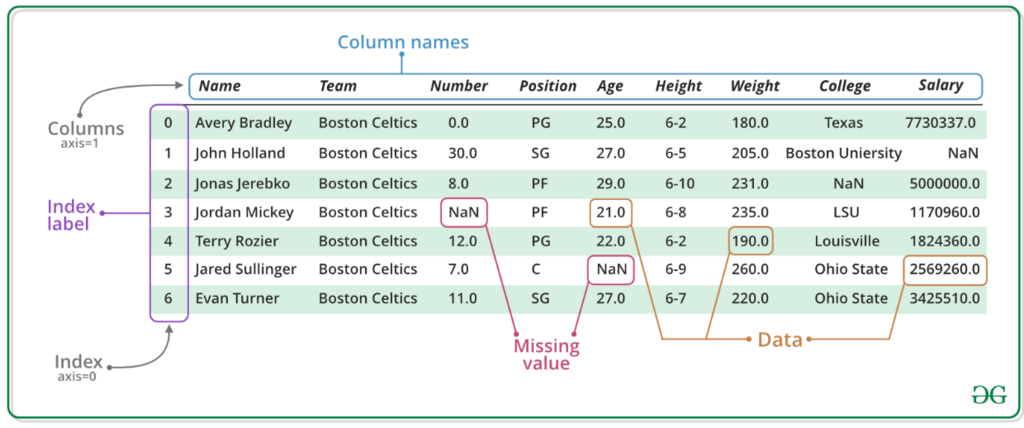
pandas allows you to load, clean, transform, merge, and reshape data. It's incredibly versatile. Here's how you might create a simple DataFrame and select a column of data from it.
# Import the pandas library
import pandas as pd

# Create a dictionary with data
data = {'Name': ['Alice', 'Bob', 'Charlie'],
        'Age': [25, 30, 35]}

# Create a DataFrame from the dictionary
df = pd.DataFrame(data)

# Select the 'Age' column
ages = df['Age']

# Print the ages
print(ages)
For plotting, the most fundamental library is matplotlib. It provides the building blocks for creating a wide variety of static, animated, and interactive visualizations in Python. While it can be complex, it offers immense control over every aspect of a figure.
Many other Python plotting libraries, like
seaborn, are built on top ofmatplotlibto provide simpler interfaces for creating common statistical plots.
Both R and Python are excellent choices for statistical analysis. R is deeply rooted in statistics and has an extensive collection of specialized packages. Python, with pandas and other libraries, offers a flexible and powerful toolkit that integrates well with other programming tasks.
Ready to check your understanding?
Which of the following is the standard Integrated Development Environment (IDE) specifically designed for R?
In Python, which library is fundamental for data analysis and introduces the core DataFrame data structure?
With your environment set up and a basic understanding of the core libraries, you're ready to start manipulating and exploring data.