Statistical Analysis for Thesis with R or Python
Introduction to R and Python
Your First Steps in R and Python
R and Python are the two most popular languages for working with data. Think of them as two different toolkits for the same job. R was built by statisticians, for statisticians, so it excels at statistical analysis and data visualization. Python, a general-purpose language, is praised for its simplicity and has powerful libraries that make it a data science powerhouse.
While they have different philosophies, the basic ideas are very similar. Learning one makes it much easier to pick up the other. We'll start with the fundamentals: how to store information and perform simple tasks in both.
Setting Up Your Workspace
Before writing code, you need a place to write it. An Integrated Development Environment, or IDE, is a software application that makes programming much easier. It's like a word processor designed specifically for code, bundling a text editor, a console to run commands, and other helpful tools into one window.
For R, the standard choice is RStudio. It’s designed specifically for R and makes managing your projects, data, and scripts straightforward.
For Python, you have more options. Many data scientists start with Jupyter Notebooks, which let you mix code, text, and results in a single, shareable document. Another excellent choice is Visual Studio Code (VS Code), a versatile code editor with fantastic Python support through extensions. For this introduction, we'll focus on the code itself, which will run in any of these environments.
The Building Blocks: Syntax and Data
At its core, programming is about storing information and doing things with it. We store information in variables, which are essentially named containers for data. Let's see how this works in R.
In R, the common way to assign a value to a variable is with the arrow operator,
<-.
# Assign the text "Hello, R!" to the variable my_message
my_message <- "Hello, R!"

# Print the contents of the variable to the console
print(my_message)

# R can also be used as a simple calculator
result <- 10 * 5
print(result)
Simple variables are just the start. Data often comes in collections, and R has a few key structures for organizing it.
vector
noun
A sequence of data elements all of the same type, like numbers or text.
# A numeric vector
numeric_vector <- c(1, 1, 2, 3, 5, 8)

# A character vector
character_vector <- c("red", "green", "blue")
When you need to mix different types of data, you use a list. For tabular data, like a spreadsheet, the go-to structure is a data frame.
# A list can hold different types of data
my_list <- list(name = "Alice", age = 30, scores = c(88, 92, 95))

# A data frame organizes data into rows and columns
students <- data.frame(
  name = c("Alice", "Bob"),
  major = c("Statistics", "Economics")
)

print(students)
Now, let's look at Python. The concepts are the same, but the syntax is a bit different. Python uses the equals sign (=) for variable assignment.
# In Python, assignment is done with =
my_message = "Hello, Python!"

# The print function works similarly
print(my_message)

# Basic math is just as easy
result = 10 * 5
print(result)
Python also has data structures for holding collections. A list is Python's most versatile container, similar to R's vector but more flexible, as it can hold items of different types. A dictionary stores data in key-value pairs, which is useful for looking up information by name.
# A Python list can hold mixed data types
a_list = [1, "apple", 3.14]

# A dictionary uses keys to access values
person = {"name": "Alice", "age": 30}

# Access data using its key
print(person["name"])
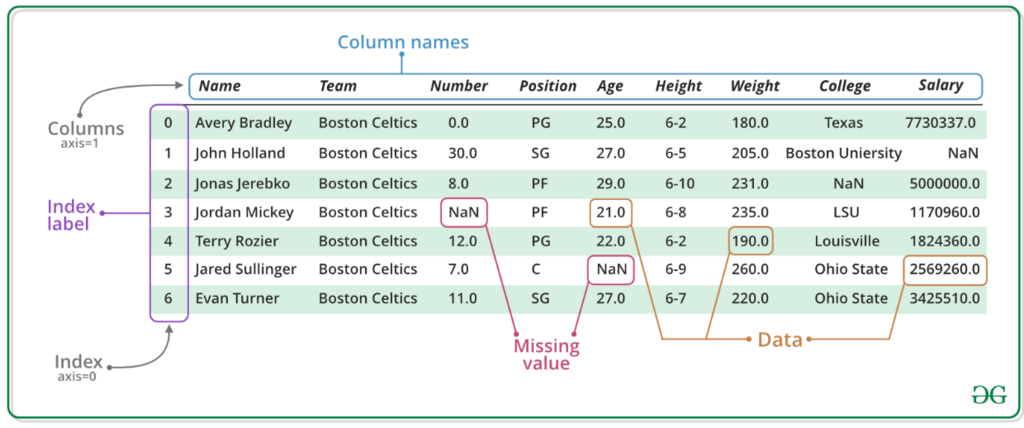
For tabular data in Python, the community has built an incredibly powerful library called pandas. The core data structure in pandas is the DataFrame, which is conceptually identical to the data frame in R.
# First, you need to import the pandas library
import pandas as pd

# Create a dictionary to hold the data
data = {
    'name': ['Alice', 'Bob'],
    'major': ['Statistics', 'Economics']
}

# Create a DataFrame from the dictionary
students_df = pd.DataFrame(data)

print(students_df)
Running Scripts and Handling Files
Writing code line-by-line in the console is great for experimenting, but for any real work, you'll save your commands in a script file. In R, these files end in .R. In Python, they end in .py. Both RStudio and VS Code make it easy to write a script and run it with a single click or command.
Getting data into your environment is a fundamental task. Most often, you'll work with CSV (Comma-Separated Values) files, which are a simple text-based format for tabular data.
Let's say you have a file named
grades.csvwith student grades. Here's how you'd load it in both languages.
In R, you can use the built-in read.csv() function.
# Read a CSV file into a data frame
grades_data <- read.csv("grades.csv")

# Display the first few rows of the data
head(grades_data)
In Python, the pandas library provides a similar function, read_csv().
# Import the pandas library first
import pandas as pd

# Read a CSV file into a DataFrame
grades_df = pd.read_csv("grades.csv")

# Display the first few rows of the DataFrame
print(grades_df.head())
Saving your results is just as simple. R uses write.csv(), and pandas has a to_csv() method that writes a DataFrame to a file.
With these basic building blocks, you can start to explore and manipulate data. You now know how to create variables, use the most important data structures, and handle files in both R and Python.