Statistical Analysis for Thesis with R or Python
Introduction to R and Python
Getting Started with R and Python
When it comes to analyzing data, two programming languages stand out: R and Python. Both are powerful, free, and backed by large communities, but they come from different places and have distinct strengths. R was built by statisticians for statistical analysis. Python, on the other hand, is a general-purpose language that has become a data science powerhouse thanks to its powerful libraries.
Think of R as a specialized workshop for statistics, while Python is a versatile, multi-purpose factory with a state-of-the-art data analysis wing.
Exploring R
R's syntax can feel a bit different if you've used other programming languages. Its primary focus has always been on making data analysis intuitive for statisticians. Everything in R is an object, and you perform actions using functions. A common assignment operator is <-, which looks like an arrow.
# Assigning a value to a variable in R
my_variable <- "Hello, R!"
print(my_variable)
R has several core data structures, but three are essential for beginners:
vector
noun
A sequence of data elements of the same basic type.
# A numeric vector
numeric_vector <- c(1, 2.5, 4)

# A character vector
character_vector <- c("a", "b", "c")
A list is a more flexible version of a vector that can hold elements of different types.
# A list containing a number, a string, and a vector
my_list <- list(10, "apple", c(1, 2, 3))
The most important data structure for data analysis in R is the data frame. It's a two-dimensional table where columns can have different data types, much like a spreadsheet.
# Creating a data frame
my_dataframe <- data.frame(
  Name = c("Alice", "Bob", "Charlie"),
  Age = c(25, 30, 35),
  IsStudent = c(TRUE, FALSE, TRUE)
)
While base R is powerful, its true strength comes from packages. Two essential packages for data analysis are dplyr for data manipulation and ggplot2 for data visualization. dplyr provides simple verbs to filter, select, arrange, and mutate your data, making complex transformations feel straightforward.
Diving into Python
Python is known for its clean, readable syntax. It was designed to be a general-purpose language, so you can use it to build websites, automate tasks, and, of course, analyze data. Its popularity in data science comes from a rich ecosystem of libraries built for numerical computing and analysis.
Python has become a go-to language for data science due to its simplicity and the powerful libraries it offers for statistical analysis.
Python's fundamental data structures include lists (ordered, changeable collections), tuples (ordered, unchangeable collections), and dictionaries (unordered collections of key-value pairs).
# A Python list
my_list = [10, "apple", 3.14]

# A Python dictionary
my_dict = {"name": "Alice", "age": 25}
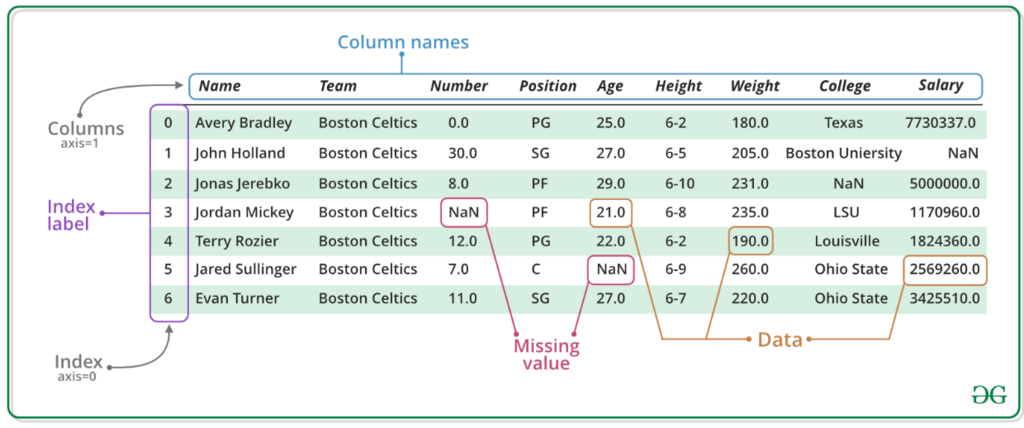
For data analysis, the most crucial library is pandas. It introduces the DataFrame, an object similar to R's data frame. It is the workhorse for cleaning, transforming, and analyzing data in Python.
import pandas as pd

# Creating a pandas DataFrame
data = {'Name': ['Alice', 'Bob', 'Charlie'],
        'Age': [25, 30, 35]}
df = pd.DataFrame(data)

print(df)
For visualization, the foundational library is matplotlib. It provides extensive control over creating static, animated, and interactive visualizations. While other libraries like Seaborn are built on top of it to make plotting prettier and simpler, understanding matplotlib is key.
Key Differences at a Glance
Choosing between R and Python often depends on your background, your team, and the specific problem you're trying to solve. R is deeply rooted in academic statistics, while Python is more common in tech and machine learning applications.
| Feature | R | Python |
|---|---|---|
| Primary Use | Statistical analysis, academic research | General programming, data science, machine learning |
| Data Structures | Vectors, lists, data frames | Lists, tuples, dictionaries, pandas DataFrames |
| Key Libraries | dplyr, ggplot2 | pandas, matplotlib, scikit-learn |
Let's review some of the key concepts we've covered.
Now, test your understanding of these foundational concepts.
R was originally designed with a primary focus on which field?
Which library is considered the foundational tool for data manipulation and analysis in Python, introducing the DataFrame object?
Ultimately, you can't go wrong with either language. Many data scientists are proficient in both. The best way to find out which one suits you is to start working with them on a small project.