Statistical Analysis for Thesis with R or Python
Introduction to R and Python
Getting Started with R and Python
When it comes to analyzing data for research, two programming languages stand out: R and Python. Both are powerful, free, and widely used by academics and professionals. Think of them as two different toolkits for the same job. R was built from the ground up specifically for statistical analysis, while Python is a general-purpose language that has become a data science powerhouse thanks to its excellent libraries.
R and Python dominate the world of statistical analysis – these two programming languages are powerful tools that offer a range of functionalities, but they come with specific advantages for different kinds of statistical modeling tasks.
Choosing between them often comes down to personal preference or the specific requirements of your field. The good news is that learning the basics of either will give you a solid foundation for any data analysis task you'll face in your research.
R and RStudio
R is a language designed by statisticians, for statisticians. Its syntax and data structures are optimized for statistical operations. To make working with R easier, most people use RStudio. It's an integrated development environment (IDE) that brings your code editor, the R console, data plots, and help files into one clean interface.
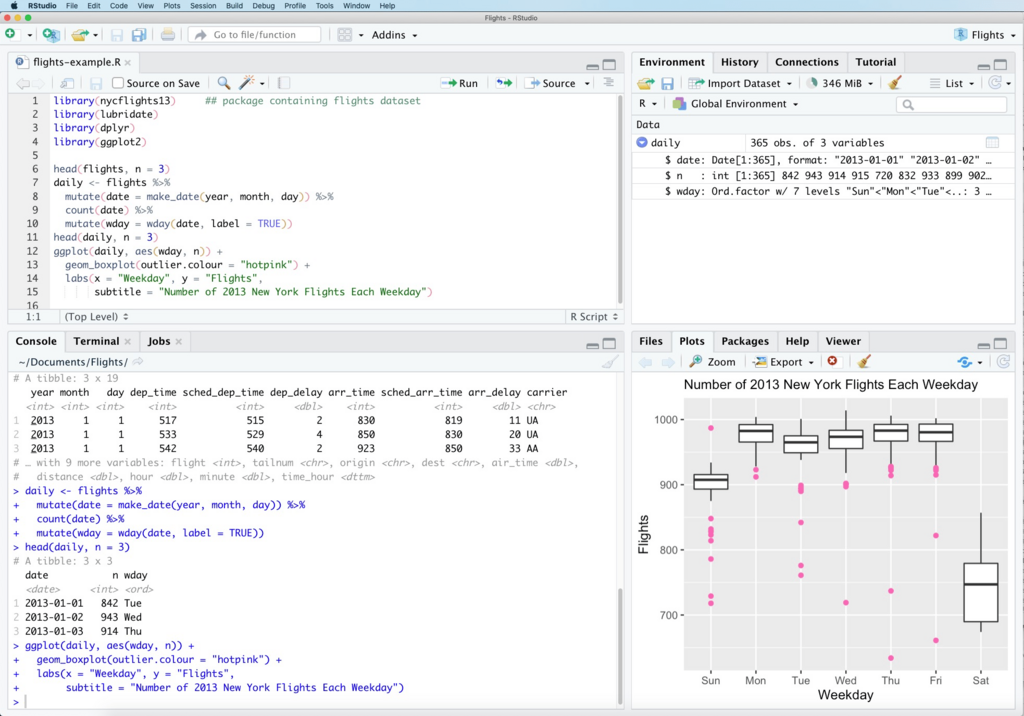
In R, you can assign data to variables using the <- operator. A fundamental data structure is the vector, which is a sequence of elements of the same type. You can create one using the c() function, which stands for "combine."
# Assign the value 5 to the variable 'a'
a <- 5

# Create a numeric vector with three numbers
my_vector <- c(10, 20, 30)

# Print the vector to the console
print(my_vector)
While R has many built-in functions, its power is extended through packages. The most essential collection of packages for data science is the tidyverse. It provides a consistent set of tools for data import, cleaning, manipulation, and visualization. We'll focus on the data manipulation parts, using packages like dplyr and tidyr that are part of the tidyverse.
Python and Jupyter
Python's popularity in data analysis comes from its simplicity and the strength of its third-party libraries. It’s a versatile language, so the skills you learn can be applied to web development, automation, and more. A popular environment for interactive data analysis in Python is the Jupyter Notebook. It allows you to write and run code in segments, called cells, and mix code with text, images, and plots in a single document.
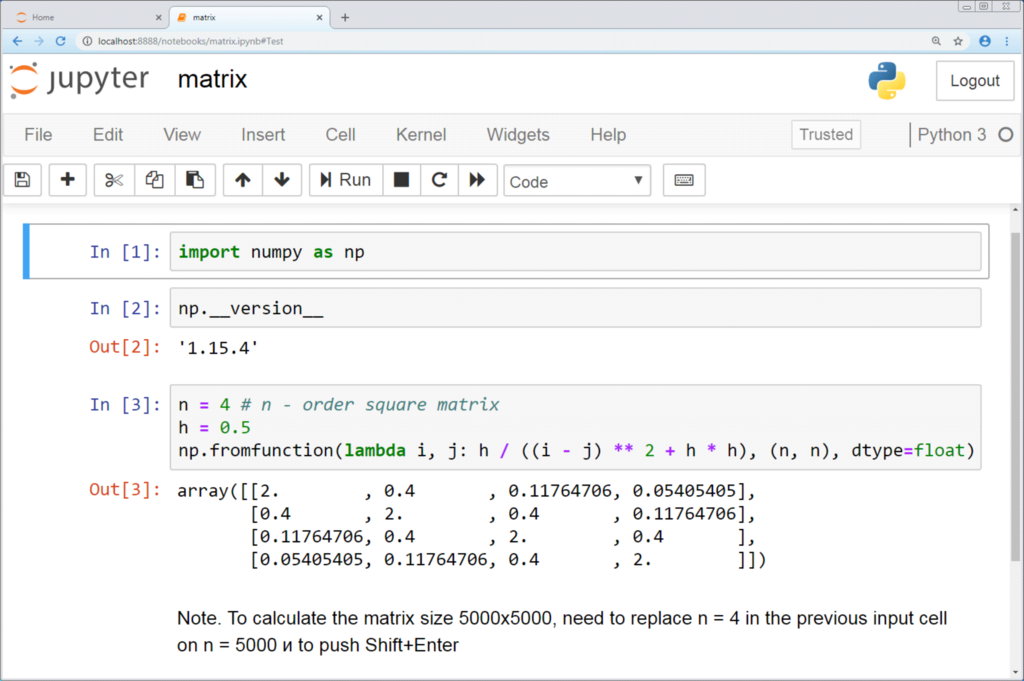
In Python, you assign variables with the = operator. The most common basic data structure is a list, which can hold elements of different types and is created with square brackets [].
# Assign the value 5 to the variable 'a'
a = 5

# Create a list with three numbers
my_list = [10, 20, 30]

# Print the list
print(my_list)
For serious data analysis, you'll use specialized libraries. The two most fundamental are NumPy and pandas.
- NumPy (Numerical Python) is the backbone for numerical computing. It introduces powerful array objects that are much more efficient for mathematical operations than standard Python lists.
- Pandas is built on top of NumPy and provides the DataFrame, a two-dimensional table structure similar to a spreadsheet or an R
data.frame. It is the primary tool for data wrangling and analysis in Python.
Core Data Structures at a Glance
While the syntax for creating variables is similar, the core data structures for holding collections of data have different names and behaviors in each language.
| Concept | R | Python (with libraries) |
|---|---|---|
| Sequence of items | vector | list or NumPy array |
| Table of data | data.frame | pandas DataFrame |
Understanding these basic building blocks is the first step toward using these languages to analyze your research data. Let's review what we've covered.
What is the primary conceptual difference between R and Python regarding their origin and purpose?
In Python, the two most fundamental libraries for numerical computing and data manipulation are:
Now that you're familiar with the key players—R, Python, RStudio, and Jupyter—and the essential libraries, you're ready to start importing and working with data.