Statistical Analysis for Thesis with R or Python
Introduction to R and Python
Getting Started with R and Python
R and Python are the two most popular programming languages for data analysis. R was built by statisticians specifically for statistical computing, so its syntax and tools are highly specialized for that purpose. Python, a general-purpose language, has become a data science powerhouse thanks to a rich ecosystem of libraries developed by its community. Both are excellent choices, and knowing the basics of each will serve you well.
Setting Up Your Environment
Before you can write any code, you need to set up your programming environment. This is the space on your computer where you'll write and run your scripts.
For R, the standard setup involves two installations. First, you'll need the R language itself, which you can download from the Comprehensive R Archive Network (CRAN). Second, you should install RStudio Desktop. RStudio is an integrated development environment (IDE) that makes working with R much easier, providing tools like a code editor, a console to run commands, and windows to view plots and data.
For Python, a popular choice is to install the Anaconda Distribution. Anaconda bundles Python with many of the most important data science libraries, along with tools like Jupyter Notebook and Spyder, which are common environments for data analysis. This saves you the trouble of installing each library individually.
Basic Syntax and Data
At its core, programming involves storing information in variables and organizing it into data structures. Let's look at the fundamentals in both languages.
In R, you often use the <- symbol for assignment. The most basic data structure is a vector, which is a sequence of elements of the same type. Multiple vectors of the same length can be combined to form a data frame, R's primary structure for tabular data.
# R Example

# Assign the value 5 to a variable named 'a'
a <- 5

# Create a numeric vector
ages <- c(25, 30, 22, 45)

# Create a character vector
names <- c("Alice", "Bob", "Charlie", "David")

# Combine vectors into a data frame
my_data <- data.frame(Name = names, Age = ages)
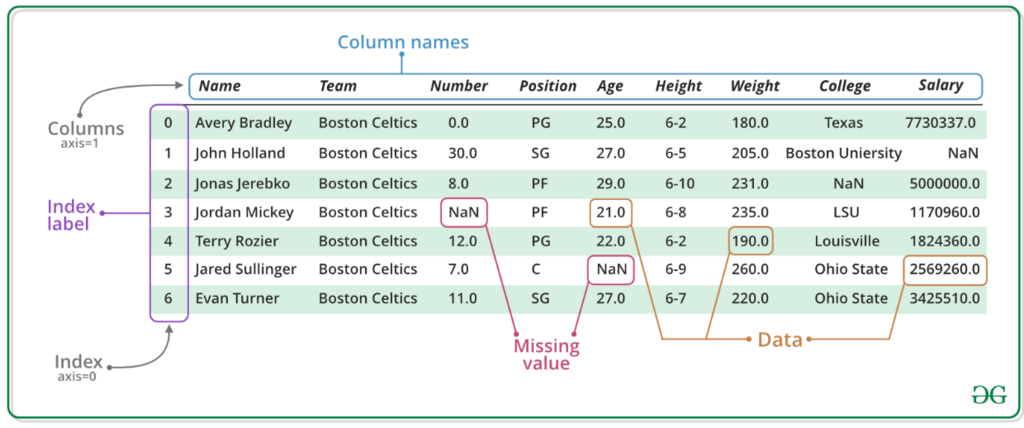
In Python, you use the = symbol for assignment. Common built-in data structures include lists (ordered collections) and dictionaries (key-value pairs). For tabular data, the community standard is the DataFrame object from the pandas library, which is very similar to R's data frame.
# Python Example
import pandas as pd

# Assign the value 5 to a variable named 'a'
a = 5

# Create a list
ages = [25, 30, 22, 45]

# Create a dictionary to hold our data
my_data_dict = {'Name': ["Alice", "Bob", "Charlie", "David"],
                'Age': ages}

# Create a pandas DataFrame from the dictionary
my_df = pd.DataFrame(my_data_dict)
Your Data Toolkit
Neither R nor Python comes with all the tools you need right out of the box. Instead, they rely on packages or libraries, which are collections of functions and tools that extend their capabilities. You install these libraries and then load them into your programming session to use their features.
Think of libraries as specialized toolkits. You wouldn't use a hammer for every job; similarly, you load specific libraries for specific tasks like data manipulation or plotting.
In R, a must-have library for data manipulation is dplyr. It provides a set of functions, often called "verbs," that make it intuitive to filter, select, arrange, and summarize your data.
In Python, the core library for data analysis is pandas. It provides the DataFrame structure and a vast array of methods to work with it. For numerical computing, you'll use NumPy, which provides efficient array objects and mathematical functions. SciPy builds on NumPy to offer more advanced scientific and statistical functions.
Loading and Exploring Datasets
The first step in any analysis is to load your data. Most often, data comes in a comma-separated values (CSV) file. Both R and Python make this easy.
In R, you can use the read.csv() function. Once loaded, you can inspect the data frame with functions like head() to see the first few rows, summary() to get descriptive statistics for each column, and str() (short for structure) to see the data types of each column.
# R: Loading and exploring data

# Read a CSV file into a data frame
# Assumes a file named 'titanic.csv' is in your working directory
titanic_data <- read.csv("titanic.csv")

# View the first 6 rows
head(titanic_data)

# Get a statistical summary
summary(titanic_data)

# Check the structure and data types
str(titanic_data)
In Python, you use the read_csv() function from the pandas library. The exploration methods are similar but have slightly different names. You use .head() to see the first few rows, .describe() for summary statistics, and .info() to check data types and look for missing values.
# Python: Loading and exploring data
import pandas as pd

# Read a CSV file into a DataFrame
# Assumes a file named 'titanic.csv' is in the same folder
titanic_df = pd.read_csv("titanic.csv")

# View the first 5 rows
titanic_df.head()

# Get a statistical summary
titanic_df.describe()

# Check the data types and non-null counts
titanic_df.info()
With these basics, you have the foundation to start manipulating and analyzing data in either language. You can load data, inspect its structure, and begin the process of cleaning and preparing it for statistical analysis.
What is the standard setup for a productive R programming environment, according to the text?
In R, the primary structure for tabular data is the data frame. What is the equivalent and most commonly used structure in Python for the same purpose?