Statistical Analysis for Thesis with R or Python
Introduction to R and Python
Your Toolkit for Data Analysis
When it comes to statistical analysis in academic research, two programming languages stand out: R and Python. Both are powerful, free, and supported by massive communities, but they have different strengths. R was built by statisticians for statisticians. It has a rich ecosystem of tools designed specifically for data analysis and visualization. Python, on the other hand, is a general-purpose language that has become a data science powerhouse thanks to its simplicity and a collection of versatile libraries.
R and Python dominate the world of statistical analysis – these two programming languages are powerful tools that offer a range of functionalities, but they come with specific advantages for different kinds of statistical modeling tasks.
You don't need to master both, but understanding the basics of each will help you choose the right tool for your work. Let's get them set up and explore their fundamental features.
Setting Up Your Environment
First, we'll set up R. You'll need two things: the R language itself and RStudio. R is the underlying programming language, and RStudio is an Integrated Development Environment (IDE) that makes working with R much easier. It gives you a code editor, a console to run commands, tools for plotting, and a way to manage your files.
To get started, first download and install R from the Comprehensive R Archive Network (CRAN). Then, download and install the free version of RStudio Desktop.
Think of it this way: R is the engine of a car, and RStudio is the dashboard, steering wheel, and seats that let you drive it comfortably.
Once installed, you can open RStudio and type your first command into the console.
# This is a comment in R
# Your first line of R code
print("Hello, R!")
Next up is Python. The most straightforward way to set up Python for data analysis is by installing the Anaconda Distribution. It bundles Python with many of the most popular data science libraries and tools, including Jupyter Notebook.
A Jupyter Notebook is an interactive environment that lets you write and run code in small blocks, called cells. You can mix code with text, equations, and visualizations, making it perfect for exploring data and sharing your findings. After installing Anaconda, you can launch a Jupyter Notebook from the Anaconda Navigator.
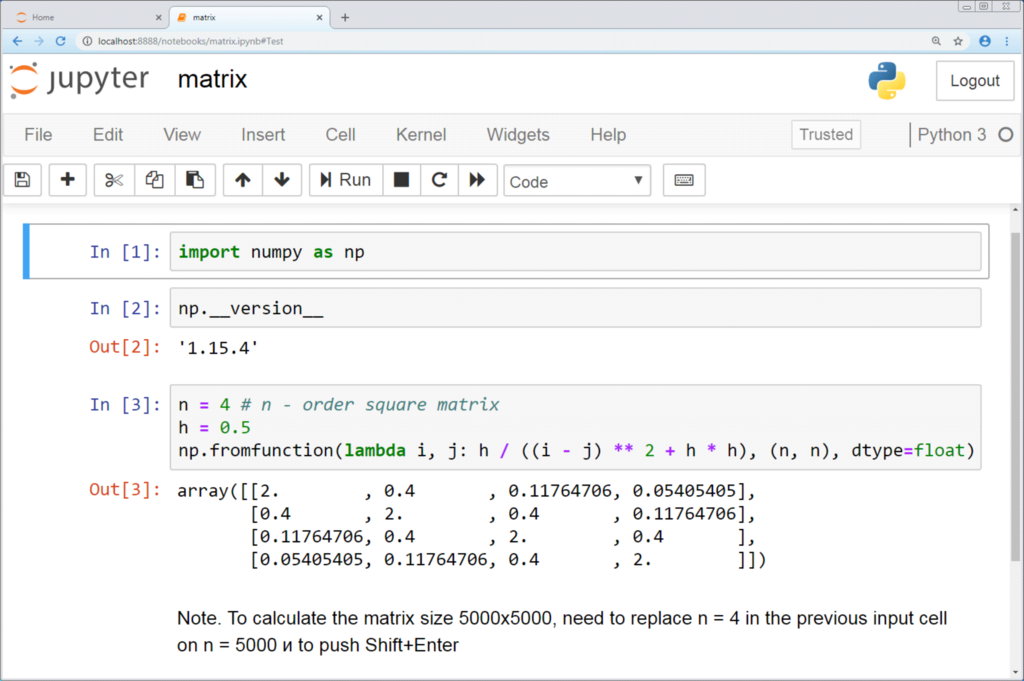
In a new notebook, you can run your first line of Python code.
# This is a comment in Python
# Your first line of Python code
print("Hello, Python!")
Language Basics
Both languages use variables to store information. The syntax is slightly different but the concept is the same. In R, the common way to assign a value to a variable is with the <- operator.
# Assigning a number to a variable in R
x <- 10

# Creating a vector (a one-dimensional array)
ages <- c(25, 30, 22, 45)
In R, a sequence of data elements of the same basic type is called a vector. The c() function is used to combine values into a vector.
In Python, you use the = operator for assignment. The most common data structure for a sequence of items is a list.
# Assigning a number to a variable in Python
x = 10

# Creating a list
ages = [25, 30, 22, 45]
While you can use = for assignment in R, using <- is a widely accepted convention that makes it clear you're assigning a value, not testing for equality.
Expanding Your Capabilities
The true power of R and Python comes from their extensive collections of third-party packages and libraries, which provide functions for specialized tasks.
In R, these are called packages. For data analysis, the tidyverse is a must-have collection of packages that work together seamlessly. It includes popular packages like ggplot2 for creating sophisticated graphics and dplyr for data manipulation.
| R Package | Primary Use |
|---|---|
dplyr | Data manipulation |
ggplot2 | Data visualization |
readr | Importing data files |
tidyr | Tidying data |
In Python, these are called libraries. For data analysis, the core libraries include pandas for working with tabular data, NumPy for numerical operations, and Matplotlib or Seaborn for plotting.
| Python Library | Primary Use |
|---|---|
pandas | Data manipulation and analysis |
NumPy | Numerical computing |
Matplotlib | Data visualization |
scikit-learn | Machine learning |
With these foundational tools and libraries, you're ready to start importing, cleaning, and analyzing data for your research. Now let's check your understanding of these core concepts.
What is the primary distinction between R and Python as described in the text?
To create a sequence of numbers (1, 5, 10) in R, you would use a vector. Which line of code correctly creates this vector and assigns it to the variable my_numbers?
Getting your environment set up is the first big step. Now you have the tools to start exploring your own data.