Statistical Analysis for Thesis
Introduction to R and Python
The Tools of the Trade
When you need to analyze data, R and Python are the two most popular programming languages for the job. Think of them as two different kinds of workshops. R is a specialized workshop designed from the ground up for statisticians. It's filled with custom tools for statistical modeling and data visualization. Python is more like a general-purpose workshop that can build anything, from websites to games. Over time, it's been outfitted with an incredibly powerful set of tools for data analysis, making it a favorite among data scientists.
R and Python dominate the world of statistical analysis – these two programming languages are powerful tools that offer a range of functionalities, but they come with specific advantages for different kinds of statistical modeling tasks.
Neither is better than the other; they're just different. Your choice will often depend on your background, your field, and what you want to accomplish. Let's look at the basics of each.
R for Statistics
R was created specifically for statistical computing. Its syntax feels natural to those with a background in statistics. Assigning a value to a variable, for instance, often uses an arrow <- which visually represents data flowing into a container.
# Assigning the value 10 to a variable named 'my_variable'
my_variable <- 10

# Performing a simple calculation
result <- my_variable * 2

# Printing the result
print(result)
R's strength comes from its data structures, which are built for analysis. The three most common are vectors, lists, and data frames.
A vector is a sequence of elements of the same type. Imagine a single column in a spreadsheet, holding only numbers or only text.
# A numeric vector of ages
ages <- c(25, 30, 22, 45)

# A character vector of names
names <- c("Alice", "Bob", "Charlie", "David")
A list is more flexible. It’s like a container where you can store anything, including other vectors or lists. Each item can be a different type.
# A list containing a name, an age, and a logical value
person <- list(name = "Alice", age = 25, is_student = TRUE)
The most important data structure for analysis in R is the data frame. It's essentially a table, like a spreadsheet, where columns are vectors of the same length. This is where you'll typically store your datasets.
# Creating a data frame from vectors
people_df <- data.frame(
  name = c("Alice", "Bob", "Charlie"),
  age = c(25, 30, 22),
  is_student = c(TRUE, FALSE, TRUE)
)
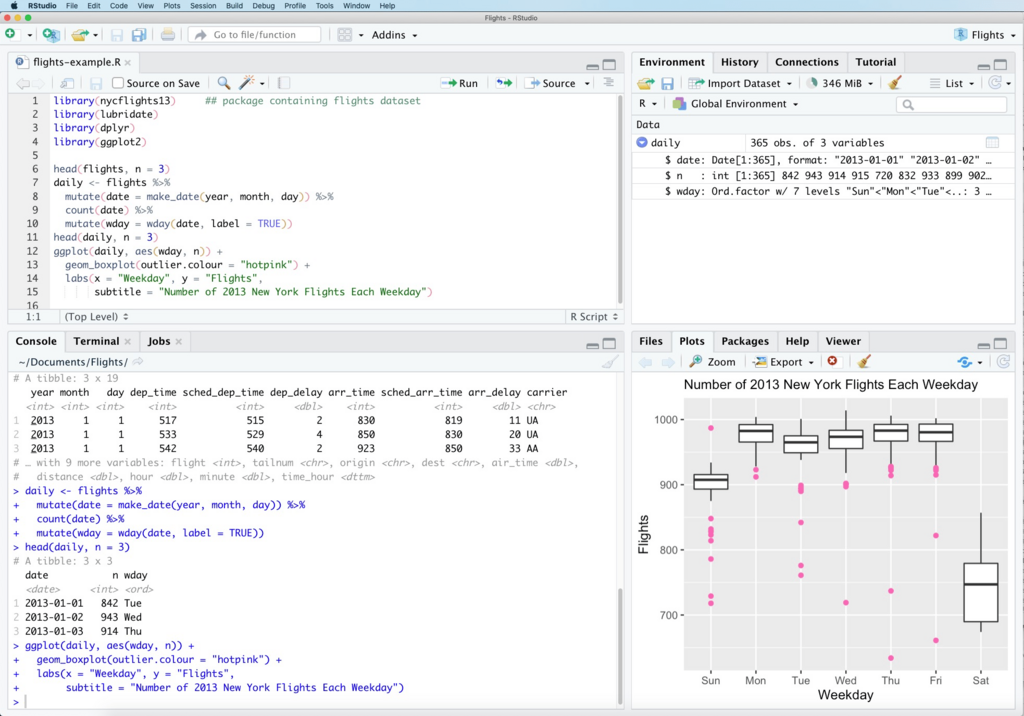
To work with data frames, R has powerful libraries. dplyr is a grammar of data manipulation, providing simple functions for filtering, selecting, and summarizing data. ggplot2 is a library for creating elegant and complex data visualizations based on a layered grammar of graphics.
Python for Data Analysis
Python was designed as a general-purpose language with a focus on readability and simplicity. Its syntax is clean and straightforward. Variable assignment uses a simple equals sign =.
# Assigning the value 10 to a variable named 'my_variable'
my_variable = 10

# Performing a simple calculation
result = my_variable * 2

# Printing the result
print(result)
Python's built-in data structures are versatile. For data analysis, you'll often use lists, tuples, and dictionaries.
A list is an ordered, changeable collection of items. It’s similar to R's vector but can hold elements of different types.
# A list of numbers
ages = [25, 30, 22, 45]

# A list with mixed data types
mixed_list = ["Alice", 25, True]
A tuple is like a list, but it's immutable, meaning you can't change its contents after it's created. This is useful for data that should not be altered, like coordinates.
# A tuple representing a point (x, y)
point = (10, 20)
A dictionary stores data in key-value pairs. Instead of accessing items by their position, you access them by a unique key.
# A dictionary holding information about a person
person = {
    "name": "Alice",
    "age": 25,
    "is_student": True
}
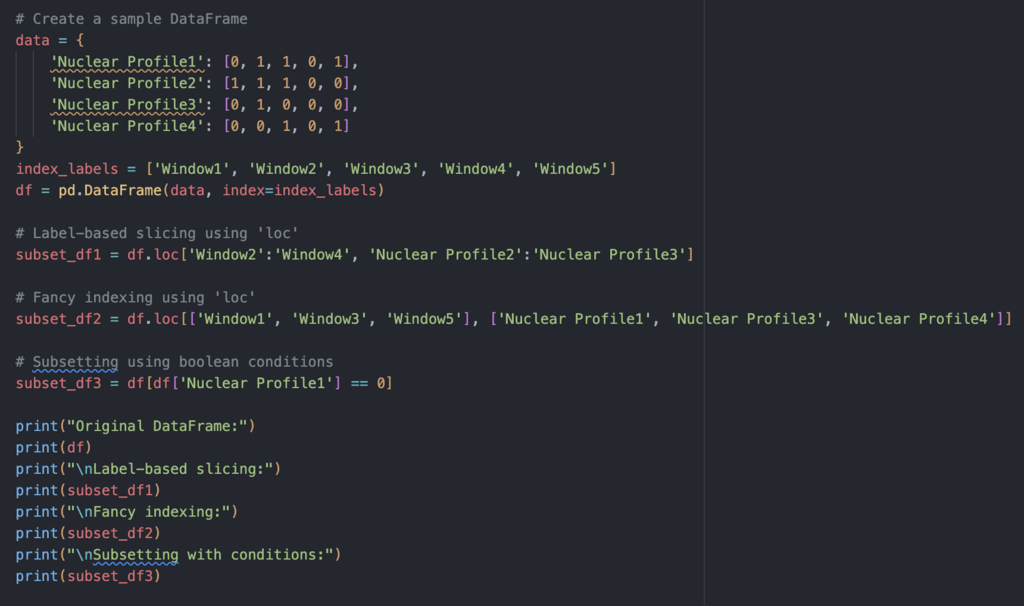
While Python's built-in structures are great, its power for data analysis comes from external libraries. The most essential is pandas, which introduces the DataFrame object. A pandas DataFrame is conceptually identical to R's data frame: a two-dimensional table for storing and manipulating data.
For visualization, matplotlib is the foundational library. It provides a wide variety of static, animated, and interactive plots. Other libraries like Seaborn are built on top of it to create more statistically-focused and aesthetically pleasing graphics.
A Quick Comparison
Both languages can get you to the same destination, but they take different paths. R is purpose-built for statistics and often requires less code for complex statistical tasks. Python is a generalist language with a gentler learning curve for programming beginners, and its libraries have made it a powerhouse for the entire data science workflow, from data collection to deployment.
| Feature | R | Python |
|---|---|---|
| Primary Use | Statistical analysis & visualization | General-purpose programming, data science |
| Learning Curve | Steeper for programming, easier for stats | Easier for programming basics |
| Data Frames | Built-in data.frame | DataFrame via the pandas library |
| Key Libraries | dplyr, ggplot2 | pandas, matplotlib, scikit-learn |
| Community | Strong in academia and research | Strong in data science and software engineering |
Now, let's review some of the key terms we've covered.
Ready to test your knowledge?
Which statement best describes the primary design philosophy of R?
In R, a data frame is the most common structure for storing a dataset. What is its conceptual equivalent in Python, provided by the pandas library?
Ultimately, the best language to learn is the one that aligns with your goals and the community you work with. Many data analysts find it valuable to know both.