Stanford's A3 Thinking Process
Components of an A3 Report
Anatomy of an A3 Report
An A3 report gets its name from a standard European paper size, roughly equivalent to an 11x17 inch sheet. The size isn't just a quirky detail; it’s a deliberate constraint. Everything you need to know about a problem, from its context to its solution, must fit on this single page. This forces clarity and conciseness.
The report tells a story, flowing logically from left to right. The left side is dedicated to understanding the problem, while the right side focuses on solving it. This structure ensures you don't jump to conclusions before grasping the situation.
Let's break down each section, starting with the left side where the problem is defined.
Defining the Problem
1. Background
This is the opening scene of your story. It sets the context. Why is this problem important right now? Who is affected? How does it connect to the organization's larger goals? Keep it brief and to the point. For example, a background might state: "Our company goal is to improve customer satisfaction, but our Net Promoter Score has dropped for two consecutive quarters."
2. Current Condition
Now, you document the reality of the situation. This section is all about facts, data, and direct observation. Avoid opinions or guesswork. Use charts, diagrams, or process maps to make the current state tangible and easy to understand. A good description of a current condition might be: "Customer support call volume has increased by 30%, with 60% of calls related to shipping delays. The average wait time is now 15 minutes, up from 5 minutes."
A clear, data-driven picture of the current condition is the foundation of effective problem-solving. Without it, you're just guessing.
3. Goal / Target Condition
With a clear understanding of the problem, you can now define success. What does the ideal future look like? The goal should be specific, measurable, achievable, relevant, and time-bound (SMART).
Instead of a vague goal like "improve shipping," a better goal would be: "Reduce shipping-related customer support calls by 50% and decrease average wait time to under 5 minutes within the next three months." This leaves no room for ambiguity.
Crafting the Solution
Once the problem is thoroughly understood, the report shifts to the right side: finding and implementing a solution.
4. Root Cause Analysis
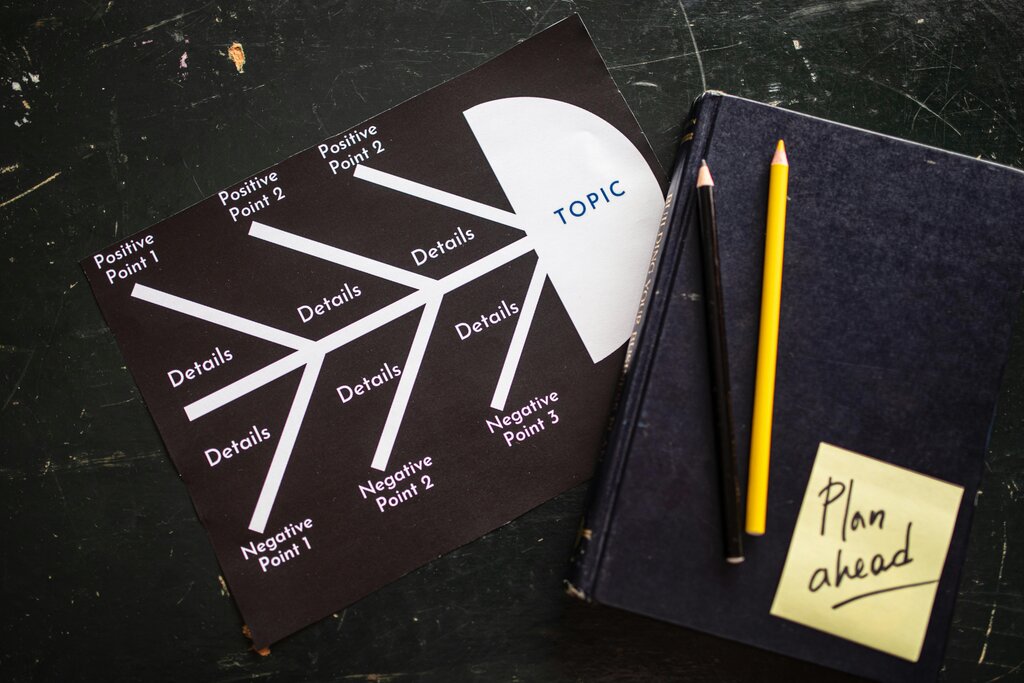
This is the core of the investigation. Here, you dig deeper than the symptoms to find the underlying cause. A common technique is the "5 Whys," where you repeatedly ask "Why?" until you arrive at the root of the issue. For instance, if shipping is delayed, why? Because packages are missing their pickup time. Why? Because the packing process is taking too long. Why? And so on. This analysis helps you fix the actual problem, not just its effects.
5. Countermeasures
Countermeasures are the specific actions you'll take to address the root causes you just identified. They are your proposed solutions. Each countermeasure should directly link to a specific root cause. If a root cause was "inadequate training on the new packing software," a countermeasure would be "Develop and deliver a mandatory 2-hour training session for all warehouse staff."
Think of these as experiments. You have a hypothesis that these actions will lead to your goal.
Good countermeasures are specific, actionable, and address the root cause, not just the symptom.
6. Implementation Plan
An idea without a plan is just a wish. This section turns your countermeasures into a concrete action plan. It details who will do what, by when, and how you will measure progress. It often looks like a simple table.
| Countermeasure | Owner | Due Date | Status |
|---|---|---|---|
| Develop training materials | Sarah | Oct 15 | In Progress |
| Schedule training sessions | David | Oct 20 | Not Started |
| Monitor call volume | Team Lead | Ongoing | In Progress |
7. Follow-up / Confirmation
This final section is where you check your results, reflecting the "Check" and "Act" stages of the PDCA cycle we discussed earlier. Did your countermeasures work? Did you achieve your goal? You'll compare your results against the target condition you set. If you succeeded, you standardize the new process. If you fell short, you analyze why and restart the cycle.
This section closes the loop, ensuring that the problem is not only solved but that the solution sticks and the team learns from the experience.
Now, let's test your understanding of the A3 report's structure.
What is the primary purpose of constraining an A3 report to a single sheet of paper?
The A3 report is logically divided into two sides. The left side is for understanding the problem, while the right side is for...