Spatial Data Analysis in R
Introduction to Spatial Data in R
What Makes Data Spatial?
Simply put, spatial data is information with a location attached. It’s not just what something is, but where it is. Think about a weather forecast. Knowing it will rain is useful, but knowing it will rain over your city is far more practical. That 'where' component is what makes the data spatial.
In the world of data analysis, spatial data comes in two main flavors: vector and raster.
Think of vector data like a drawing made with lines and shapes. It's precise and defined. Raster data is more like a photograph, made up of a grid of pixels, where each pixel has a value.
Raster data is great for continuous information, like temperature or elevation across a landscape. For now, we'll focus on vector data, which is used to represent distinct, individual features on the Earth's surface.
The Building Blocks of Vector Data
Vector data represents geographic features using three basic shapes: points, lines, and polygons. Each shape is defined by a set of coordinates (like x and y values on a graph) that pinpoints its location.
Point
noun
A single pair of coordinates representing a specific location.
Points are the simplest form. They can represent anything from a single tree to a city on a world map. The scale of your map determines what a point signifies.
Line
noun
A sequence of connected points.
Connect two or more points, and you get a line. Lines are perfect for representing features with length but not much width, like roads, rivers, or hiking trails.
Polygon
noun
A series of connected points that form a closed shape.
When a line's start and end points meet, they form a polygon. Polygons are used to show areas, such as the boundary of a country, the outline of a lake, or the footprint of a building.
A Universal Language for Maps
Imagine you have two maps of the same area from different sources. You try to lay one on top of the other, but they don't line up. Roads are slightly off, and city markers don't match. This is a common problem in spatial analysis, and it's solved by something called a Coordinate Reference System (CRS).
A CRS is a standardized way of defining how the three-dimensional Earth is represented on a two-dimensional surface, like a computer screen. It's the 'frame of reference' for your data. It ensures that when you combine data from different files, all the points, lines, and polygons align perfectly.
Think of a CRS as a shared language. For two maps to be understood together, they must speak the same CRS language.
Every piece of spatial data has a CRS associated with it. When working in R, one of the first steps is often to check and confirm that all your data layers share the same CRS. If they don't, you'll need to transform them so they do.
Handling Spatial Data in R
So, how does R fit into all this? R is a powerful tool for data analysis, and with the help of specialized packages, it becomes an excellent environment for working with spatial data. These packages provide the functions needed to read, write, manipulate, and visualize spatial information.
You can import files containing vector data, like shapefiles or GeoJSON files, directly into R. Once loaded, R treats this data as a special type of object that 'knows' it has a spatial component. It stores the coordinates for all the points, lines, and polygons, as well as the all-important CRS information.
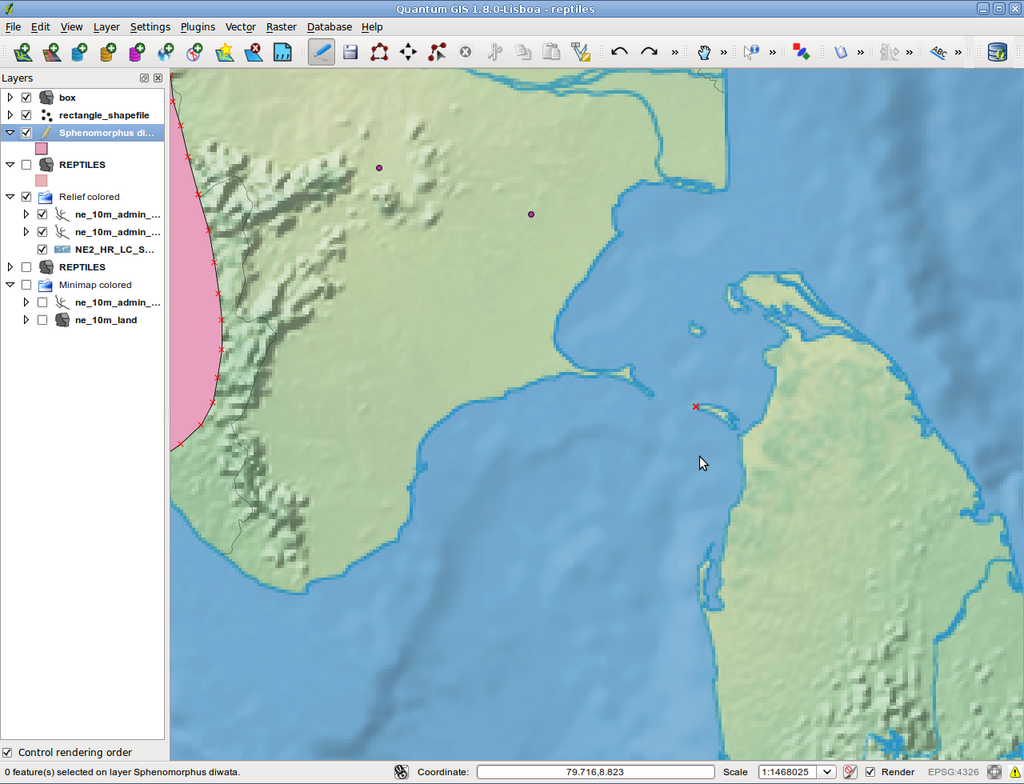
With this foundation, you're ready to start exploring the tools R offers for asking geographic questions, like finding the distance between two points or seeing which parks fall inside a city boundary. But first, it's crucial to be comfortable with these core concepts.
Let's review the key terms we've just covered.
Now, let's test your understanding.
What is the key characteristic that defines spatial data?
Vector data represents distinct geographic features using which three basic shapes?
Understanding these fundamentals—vector vs. raster, the components of vector data, and the role of a CRS—is the first step toward performing powerful spatial analysis in R.