Short-Run Macroeconomic Equilibrium
Introduction to Macroeconomic Models
Models as Economic Maps
Macroeconomic models are like maps for an entire economy. A real map doesn't show every single tree or house, but it gives you the essential information to get from point A to point B. Similarly, economic models simplify the complex reality of billions of transactions to help us understand the big picture.
These models help economists and policymakers analyze major issues like inflation, unemployment, and economic growth. They're tools for thinking through the potential effects of different events, like a change in government spending or a global pandemic.
Think of it like a weather forecast. It isn't always perfect, but it's based on powerful models that help us understand complex systems. An economic model does the same, offering a structured way to think about how different parts of the economy fit together.
The Core Components
At the heart of most short-run macroeconomic models are two key concepts: aggregate demand and aggregate supply. They're the economy-wide versions of the supply and demand you might already know.
Aggregate Demand
noun
The total quantity of all goods and services demanded by households, firms, the government, and foreign customers at any given price level.
Aggregate Demand (AD) is made up of four parts:
- Consumption (C): Spending by households on goods and services.
- Investment (I): Spending by businesses on new equipment and buildings, plus household purchases of new housing.
- Government Spending (G): Spending by all levels of government on things like infrastructure and defense.
- Net Exports (NX): The value of a country's exports minus the value of its imports. This component accounts for international trade.
Aggregate Supply
noun
The total quantity of all goods and services that firms in an economy are willing and able to produce at any given price level.
Aggregate Supply (AS) represents the production side of the economy. In the short run, the aggregate supply curve slopes upward. This is because some business costs, like wages set by contracts, are “sticky” and don’t adjust immediately to price changes. So, if the overall price level rises, firms can sell their products for more while their costs stay temporarily fixed, encouraging them to produce more.
The point where the AD and AS curves cross is the economy's short-run equilibrium. It shows the overall price level and the total amount of output (Real GDP) in the economy at a particular time.
Explaining Economic Ups and Downs
The real power of the AD-AS model is in showing how the economy can change. Economic fluctuations, often called the business cycle, happen when one of these curves shifts.
An event that changes aggregate demand or aggregate supply is called a "shock." These shocks are what push the economy into periods of expansion or recession.
For example, imagine a wave of optimism sweeps the country. Consumers feel confident about the future and start spending more. This increases Consumption (C), a component of aggregate demand. The whole AD curve shifts to the right. As a result, both the price level and Real GDP increase. The economy experiences a boom.
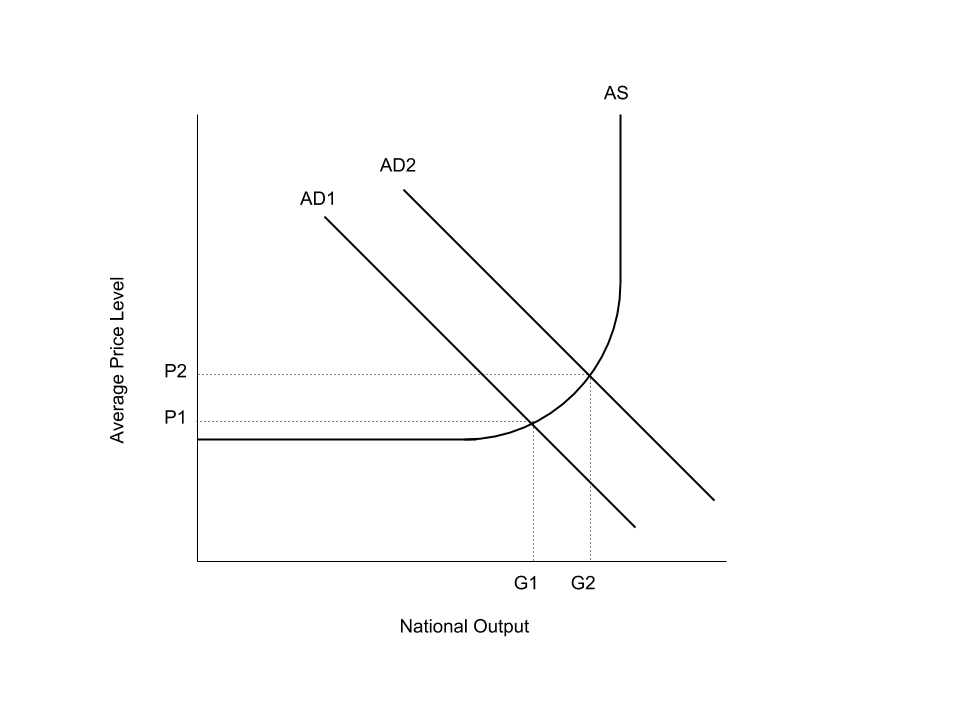
Conversely, a negative shock could shift the AD curve to the left, leading to a recession. This might happen if a major trading partner's economy weakens, causing a drop in Net Exports (NX).
Shifts can also happen on the supply side. A sudden, sharp increase in the price of oil, a key input for many industries, would make production more expensive. This would shift the short-run AS curve to the left. The result is not pleasant: a higher price level (inflation) and lower output (stagnation). This combination is often called "stagflation."
This is where governments and central banks often step in. They can use policy tools to try and shift the AD curve to counteract these shocks and stabilize the economy. For instance, in a recession, the government might increase its spending (G) or cut taxes (which boosts C) to shift AD back to the right.
In the context of the Aggregate Demand-Aggregate Supply model, what does the 'I' in the equation AD = C + I + G + NX represent?
Why does the short-run aggregate supply (AS) curve typically slope upward?
Macroeconomic models provide a framework for understanding the complex forces that shape our economy. By breaking it down into aggregate demand and aggregate supply, we can begin to analyze why economies experience booms and busts and what role policymakers can play.