Setting Up Your ELK Log Management System
Introduction to ELK Stack
What Is the ELK Stack?
Managing data from various sources can feel like trying to listen to a dozen conversations at once. Logs, metrics, and other data streams pour in from servers, applications, and devices. Without a central place to gather and analyze this information, finding the root cause of a problem is a nightmare. This is where the ELK Stack comes in.
The ELK Stack is a collection of three open-source products : Elasticsearch, Logstash, and Kibana.
Together, these three tools form a powerful platform for centralized log management. The stack allows you to collect logs from all your systems, process them, and store them in one place where you can search, analyze, and visualize the data in real-time. Think of it as creating a single, searchable library for all your machine-generated data.
The Three Pillars
Each component of the ELK Stack has a distinct role. Let's break down what each one does.
Elasticsearch
noun
A distributed, RESTful search and analytics engine capable of solving a growing number of use cases. It centrally stores your data for fast searching and analysis.
Elasticsearch is the heart of the stack. It’s built on Apache Lucene and acts as a powerful search engine for your data. When Logstash sends processed information, Elasticsearch indexes and stores it in a way that makes it incredibly fast to search and query, even across massive datasets. It’s like a highly organized digital filing cabinet designed for speed and scale.
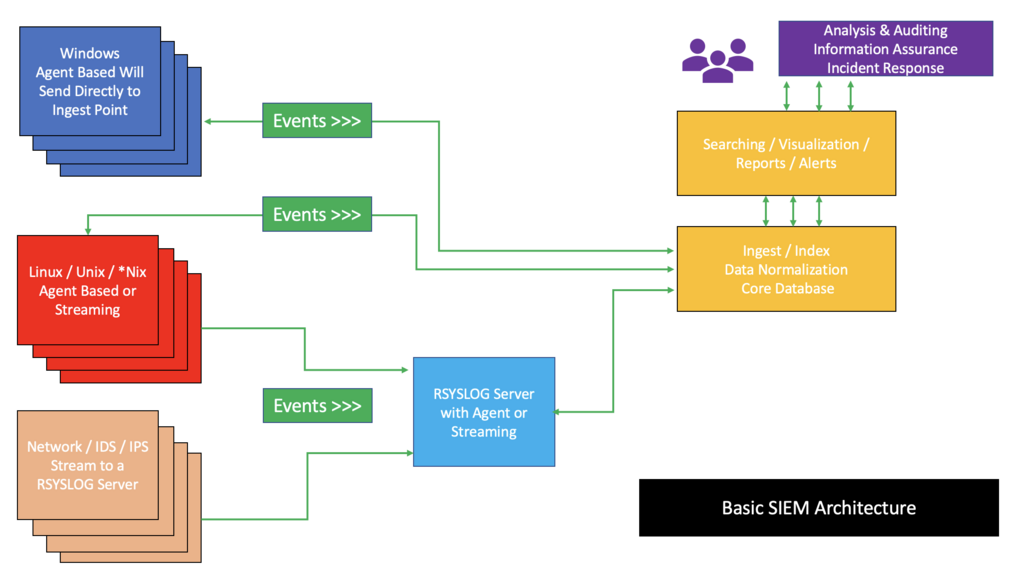
Next up is Logstash, the data pipeline of the stack. Its job is to collect data from a wide variety of sources, transform it into a common format, and then send it to a destination, or "stash." In the ELK Stack, that destination is almost always Elasticsearch.
Logstash can pull from logs, metrics, files, and more. It then parses this data, filtering out irrelevant information, enriching it with extra context (like adding geolocations to IP addresses), and structuring it before sending it on. This processing step is crucial for making the raw data useful for analysis.
input {
  file {
    path => "/var/log/apache.log"
    type => "apache-access"
  }
}

filter {
  # Here you could parse the log, add geo IP info, etc.
  grok {
    match => { "message" => "%{COMBINEDAPACHELOG}" }
  }
}

output {
  elasticsearch {
    hosts => ["localhost:9200"]
  }
}
Finally, there's Kibana. Kibana is the window into your data. It’s a powerful and flexible visualization tool that lets you explore the information stored in Elasticsearch. With Kibana, you can create interactive charts, graphs, maps, and tables to build custom dashboards.
This is where the raw logs and metrics become actionable insights. Instead of scrolling through thousands of lines of text, you can see performance trends, identify error spikes, or map out user activity with just a few clicks.
Kibana turns your data into a story. You can build dashboards that show you the health of your applications, track key performance indicators, or investigate security events visually.
Common Use Cases
So, what do people actually do with the ELK Stack? The applications are incredibly broad, but they often fall into a few key areas.
| Use Case | Description |
|---|---|
| Log Analytics | The most common use. Developers and operations teams can search and analyze application and infrastructure logs to troubleshoot issues quickly. |
| Security and Compliance | Security teams use ELK to centralize and analyze security logs from firewalls, servers, and applications to detect threats and investigate incidents. |
| Business Intelligence | By ingesting data about user clicks, transactions, or other business events, companies can use Kibana to visualize trends and make data-driven decisions. |
| Application Performance Monitoring (APM) | The stack can be used to collect and analyze metrics and traces from applications to monitor performance and identify bottlenecks. |
By centralizing log management, the ELK Stack provides a single source of truth for your system's operational data. This unified view makes it easier to correlate events across different services, understand complex interactions, and ultimately maintain healthier, more reliable systems.
Time to check your understanding.
What is the primary role of Elasticsearch within the ELK Stack?
Which component of the ELK Stack is described as the "data pipeline" responsible for collecting and processing information before it's stored?
Now that you're familiar with the core components and benefits, you have a solid foundation for understanding how log management systems work.