Senior Data Scientist Profile Explained
Statistical Modeling
Building with Models
Statistical modeling is about more than just prediction. It’s about understanding the world through data. A model is a simplified representation of reality, built to uncover the relationships between different variables. By creating these models, we can quantify how a change in one factor might influence another, allowing us to move from correlation to a deeper understanding of the systems we're studying.
The core idea is to express the relationship between a dependent variable (the outcome we care about) and one or more independent variables (the factors we think influence the outcome) using a mathematical equation. This allows us to test hypotheses, estimate the magnitude of effects, and make informed decisions based on evidence rather than intuition alone.
Statistical techniques like hypothesis testing and regression analysis allow data scientists to test assumptions, validate models, and guide business strategies with confidence.
Let's explore some of the foundational models that are essential tools for any data scientist.
Linear Regression
The simplest place to start is with linear regression. This technique models the relationship between a continuous dependent variable, , and one or more independent variables, . The goal is to find a straight line that best fits the data points. For a single independent variable, the model takes a familiar form.
Here, is the intercept (the value of when is 0), and is the coefficient for our independent variable . It represents the change in for a one-unit change in . The term represents the error, or the part of that our model can't explain.
The model finds the best values for and by minimizing the sum of the squared differences between the actual values and the values predicted by the line. This is called the method of least squares. When you fit a linear regression model, you'll look at the coefficients to understand relationships and the R-squared value to see how much of the variance in your model explains.
A key insight from linear regression is the interpretation of its coefficients. A coefficient of 2.5 for a variable like 'years of experience' in a salary model suggests that, holding all other factors constant, an additional year of experience is associated with an increase of 💲2,500 in salary.
Logistic Regression
What happens when your outcome isn't a continuous number, but a binary choice like 'yes' or 'no'? A customer either churns or doesn't. A transaction is either fraudulent or it isn't. For these cases, we use logistic regression.
Instead of predicting a value directly, logistic regression predicts the probability that belongs to a particular category. It does this by passing the linear equation through a logistic function, also known as the sigmoid function. This function squishes any real-valued number into a range between 0 and 1.
The output, , is the probability of the outcome being '1' (e.g., churn). Because the relationship isn't linear, interpreting the coefficients is different. They represent the change in the log-odds of the outcome for a one-unit change in the predictor. To make this practical, we often convert the coefficient back into an odds ratio by taking its exponential, .
An odds ratio of 1.2 for a 'number of support tickets' variable means that for each additional support ticket, the odds of a customer churning increase by 20%.
Time Series Analysis
When data is collected over time, the order of the observations matters. This is time series data, and it requires special techniques. Time series analysis helps us understand patterns like trends, seasonality, and cycles to make forecasts.
A common first step is to decompose a time series into its core components:
| Component | Description |
|---|---|
| Trend | The long-term direction of the data (e.g., increasing sales over years). |
| Seasonality | A repeating, fixed-period pattern (e.g., higher sales every winter). |
| Noise | Random, irregular fluctuations that are not explained by the other components. |
Models like ARIMA (Autoregressive Integrated Moving Average) are built to capture these dynamics. They use past values (autoregressive part) and past forecast errors (moving average part) to predict future values. A crucial assumption in many time series models is stationarity—meaning the statistical properties of the series, like mean and variance, are constant over time.
Assumptions and Validation
No model is perfect, and every statistical model is built on a foundation of assumptions. For linear regression, key assumptions include linearity (the relationship between X and Y is linear), independence of errors, homoscedasticity (errors have constant variance), and normality of errors. If these assumptions are violated, your model's conclusions can be misleading.
How do you know if your model is any good? Through validation. We don't just build a model; we test it rigorously. A fundamental technique is splitting your data into training and testing sets.
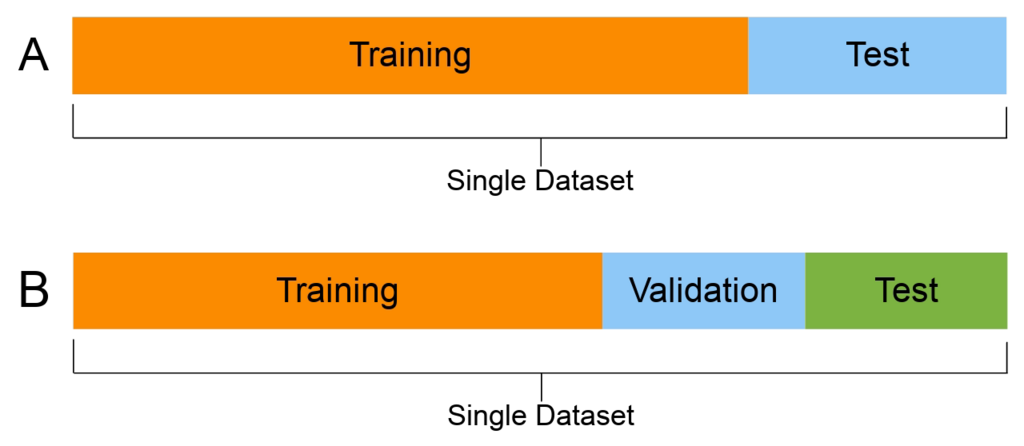
You build the model on the training data and then evaluate its performance on the unseen testing data. For time series, this split must respect the temporal order—you train on the past and test on the more recent future.
Common validation metrics depend on the model type:
- Linear Regression: Mean Absolute Error (MAE), Mean Squared Error (MSE), R-squared.
- Logistic Regression: Accuracy, Precision, Recall, F1-Score, Area Under the ROC Curve (AUC).
- Time Series: Metrics similar to linear regression, but calculated on out-of-sample forecasts.
Techniques like cross-validation provide a more robust estimate of model performance by creating multiple train/test splits from the data and averaging the results. This helps ensure your model generalizes well to new, unseen data.
Time to check your understanding of these core modeling concepts.
What is the primary goal of statistical modeling as described in the provided text?
For which of the following scenarios would logistic regression be the most appropriate modeling technique?
Statistical models are the bridge between raw data and actionable insight. By understanding how to build, interpret, and validate them, you can uncover the stories hidden within your data.