Restaurant Controller Mastery
Advanced Financial Analysis
Beyond the Basics
You already know your way around an income statement, balance sheet, and cash flow statement. They provide a snapshot of your restaurant's financial health. But to truly understand performance, you need to look at the relationships between those numbers. Financial ratios are the tools for that job.
Think of them as diagnostic tests. They help you compare your performance period over period, measure yourself against industry benchmarks, and uncover the story hidden in your financial data. Let's dive into the key ratios every restaurant operator should track.
One critical step to understanding effective financial statement analysis is gaining in-depth knowledge of the balance sheet, income statement, and cash flow statement.
Measuring Profitability
Profitability ratios cut to the chase: Is the business making money, and how efficiently? They reveal how well you convert sales into actual profit.
Profitability
noun
The degree to which a business or activity yields a financial gain.
A primary measure is the Gross Profit Margin. This tells you how efficiently you're turning ingredients and beverages into revenue, before accounting for labor and other operating costs.
For the bigger picture, you look at the Net Profit Margin. This is the ultimate measure of profitability, showing what percentage of revenue is left after all expenses are paid, including labor, rent, marketing, and taxes.
Finally, Return on Assets (ROA) measures how effectively your assets, like kitchen equipment, furniture, and property, are being used to generate profit.
Gauging Liquidity
Liquidity is about short-term survival. Can you pay your upcoming bills? Your suppliers, employees, and landlord all need to be paid on time. Liquidity ratios give you a clear answer to this critical question.
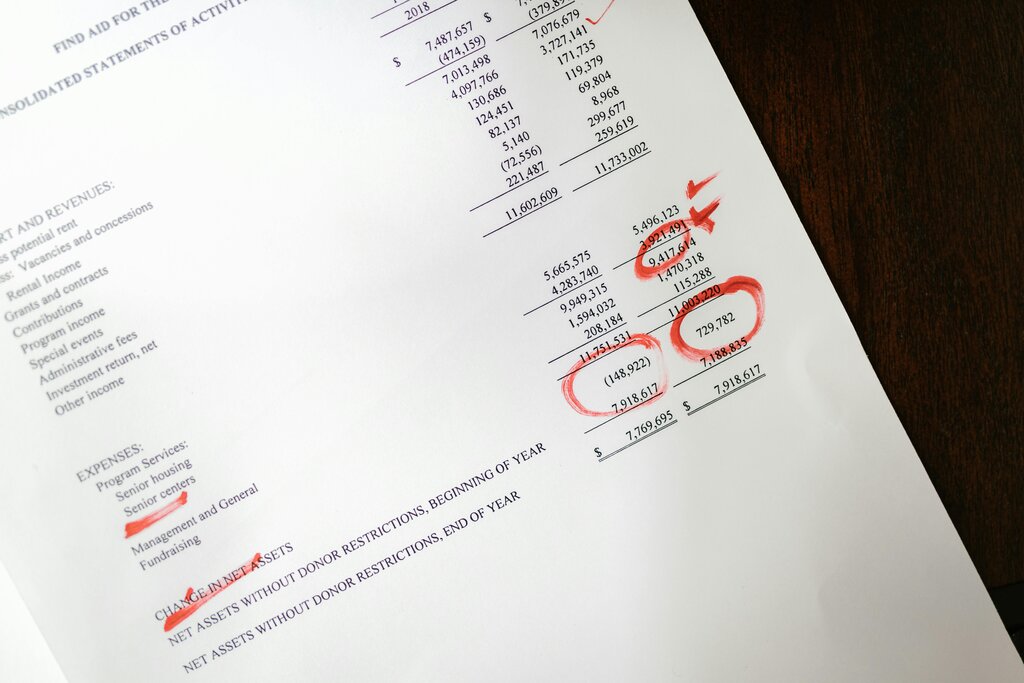
The most common liquidity measure is the Current Ratio. It compares everything you own that can be converted to cash within a year (current assets) to everything you owe in that same timeframe (current liabilities).
A stricter test is the Quick Ratio, also known as the acid-test ratio. It's similar to the current ratio but excludes inventory from current assets. In the restaurant business, food inventory is perishable and can't always be quickly converted to cash, making this a very useful metric.
Operational Efficiency
Efficiency ratios, or activity ratios, measure how well you're using your assets and managing your liabilities. They show how effectively your restaurant is running its day-to-day operations.
Excellent operations are the bedrock of a profitable restaurant. These metrics show you where to fine-tune the machine.
The Inventory Turnover ratio shows how many times you've sold and replaced your entire inventory during a specific period. A higher turnover is generally better, indicating that your food is fresh and you aren't overstocking, which ties up cash and increases the risk of spoilage.
Another crucial, restaurant-specific metric is Revenue per Seat Hour (RevPASH). This helps you understand how effectively you are using your dining space over time. It's particularly useful for optimizing table turnover and seating strategies during peak hours.
Spotting the Trends
Calculating these ratios for a single period is useful, but their true power is revealed through trend analysis. This involves comparing ratios over multiple periods, such as month-over-month or year-over-year, to identify patterns.
Are your profit margins shrinking? Is your inventory turnover slowing down? A single data point is a snapshot; a trend is a story. By tracking these ratios over time, you can spot problems early and make proactive adjustments.
For example, if you see your Gross Profit Margin declining over several months, it's a clear signal to investigate your food costs. Are your supplier prices increasing? Is there an issue with portion control or waste in the kitchen? Trend analysis turns financial data into an actionable management tool.
| Period | Gross Profit Margin | Current Ratio | Inventory Turnover |
|---|---|---|---|
| Q1 | 72% | 1.3 | 45 |
| Q2 | 70% | 1.1 | 42 |
| Q3 | 68% | 0.9 | 38 |
| Q4 | 67% | 0.8 | 35 |
In the table above, the negative trend in all three ratios would be a major red flag, prompting an immediate investigation into costs, short-term debt, and inventory management.
By regularly calculating and analyzing these advanced metrics, you move beyond simple bookkeeping and into the realm of strategic financial management.