Regression Residuals OLS Assumptions and Alpha
Introduction to Regression Analysis
Finding Patterns in Data
Imagine you're trying to sell your house. You'd probably wonder what a fair price is. You might think about its size, the number of bedrooms, or its location. Intuitively, you know these factors are related to the final price. A bigger house in a good neighborhood usually sells for more.
Regression analysis is a statistical tool that formalizes this intuition. It helps us understand and measure the relationship between different variables. At its core, regression does two main things:
- It describes relationships. It can tell you how much one variable affects another. For example, exactly how much does an extra bedroom add to a house's value, on average?
- It makes predictions. Once you understand a relationship, you can use it to forecast future outcomes. If you know how square footage affects price, you can predict the sale price of a house you've never seen before.
The Key Players
Every regression model has at least two types of variables. Understanding their roles is key to understanding regression.
Dependent Variable
noun
The main thing you are trying to understand or predict. It's the outcome or the effect.
Think of the dependent variable as the result. In our housing example, the dependent variable is the home's selling price. It depends on other factors.
Independent Variable
noun
A factor that you believe has an impact on the dependent variable. It's the cause or the input.
These are the factors we use to explain or predict the change in the dependent variable. For the house price, independent variables would be the square footage, number of bathrooms, and age of the house. You can have one or many independent variables.
Regression in the Real World
Regression isn't just for real estate. It's used across countless fields to make better decisions.
| Field | Independent Variable(s) (The Cause) | Dependent Variable (The Effect) |
|---|---|---|
| Business | Advertising budget, promotion discounts | Monthly Sales |
| Healthcare | Dosage of a drug, patient age | Patient Recovery Time |
| Agriculture | Amount of fertilizer, rainfall | Crop Yield (tons per acre) |
| Finance | Company earnings, interest rates | Stock Price |
| Education | Hours spent studying, previous grades | Final Exam Score |
In each case, we're using something we know (the independent variables) to make an educated guess about something we want to know (the dependent variable).
Linear regression analysis is used to predict the value of a variable based on the value of another variable.
The core of regression is creating a mathematical model, or an equation, that best describes the relationship between the variables. For a simple case with one independent variable () and one dependent variable (), the model can be visualized as a straight line drawn through the data points.
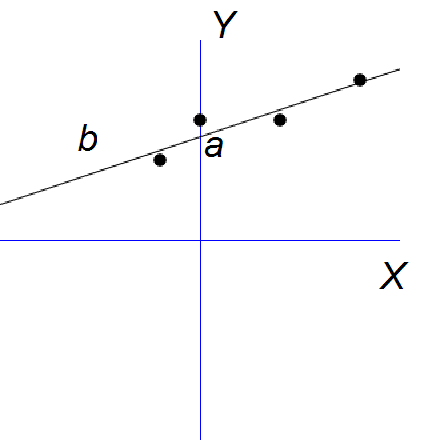
The goal is to find the exact line that comes closest to all the data points combined. This line represents our model. Once we have it, we can pick any value for our independent variable (), find that point on the line, and see the model's prediction for the dependent variable (). This simple idea of fitting a line to data is the foundation of many powerful predictive tools.
What are the two primary goals of regression analysis?
A coffee shop owner wants to predict daily ice cream sales based on the day's high temperature. In this analysis, the high temperature is the __________ variable.
That's the basic idea of regression. It's a way to find the signal in the noise, turning data into insights and predictions.