Regression Analysis Essentials
Introduction to Regression Analysis
Finding Patterns in the Noise
How are two things related? If one thing changes, does it affect another? We ask these kinds of questions all the time. For example, does an increase in temperature cause ice cream sales to go up? Do more hours of studying lead to a better exam score?
Regression analysis is a statistical tool that helps us answer these questions. It's a way to model the relationship between different factors, or variables. By understanding these connections, we can often predict what might happen in the future.
The main goal of regression is to understand how one variable changes when another variable is changed.
The Key Players
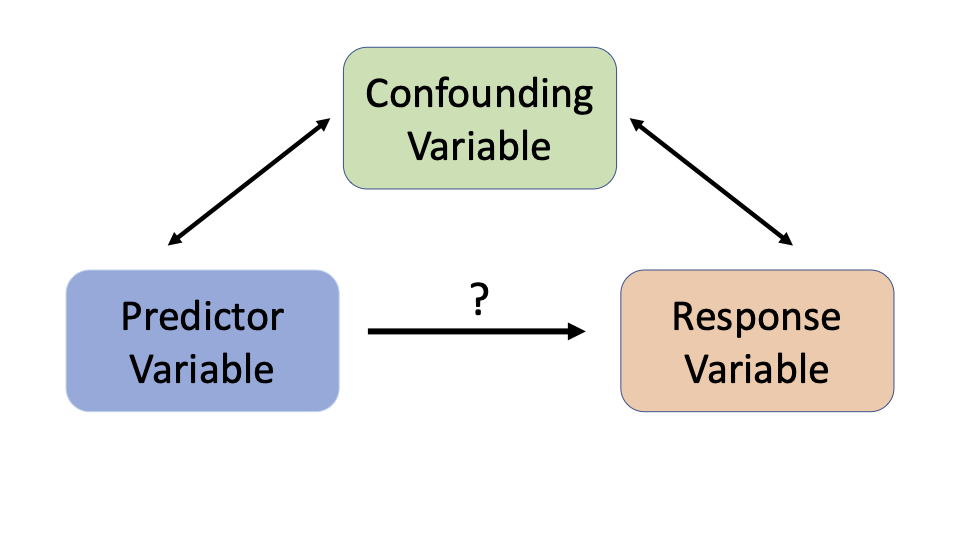
In any relationship, there's usually a cause and an effect. One variable seems to drive the change in the other. In regression, we give these variables special names.
Independent Variable
noun
The variable that you believe influences another variable. It's the one you control or observe to see its effect. It's sometimes called the predictor or explanatory variable.
This is the factor we think is the cause.
Dependent Variable
noun
The variable that is being measured or tested in an experiment. Its value depends on the independent variable.
This is the effect we are interested in measuring. So, if we are looking at study hours and exam scores, the number of hours you study is the independent variable, and your final score is the dependent variable.
Shapes of Relationships
Relationships between variables can take different forms. Some are simple and straightforward, while others are more complex. The two main types of regression are based on the shape of this relationship.
Linear regression is used when the relationship between variables can be drawn as a straight line. For every one-unit increase in the independent variable, the dependent variable changes by a consistent amount. Think of it like a car traveling at a constant speed.
Nonlinear regression is for relationships that don't follow a straight line. The effect of the independent variable changes depending on its value. For instance, the benefit of a vitamin might level off after a certain dosage. This relationship would look like a curve, not a straight line.
Regression in the Real World
Regression isn't just an abstract concept. It's used everywhere to make sense of the world and make better decisions.
-
Economics: Economists use regression to understand how factors like interest rates or unemployment affect consumer spending.
-
Finance: In the financial world, regression can help determine how a stock's price is affected by movements in the broader market.
-
Healthcare: Medical researchers might use regression to see if a new drug is more effective than an old one, or to identify risk factors for diseases based on patient data.
Ready to check your understanding of these core ideas?
What is the primary purpose of regression analysis?
In a study examining the effect of advertising spending on product sales, what is the dependent variable?
By finding the patterns that connect variables, regression analysis gives us a powerful lens for looking at data.