Regression Analysis Essentials
Introduction to Regression
Finding Patterns in Data
Regression analysis is a tool for understanding the relationship between different things. At its core, it helps us see how one variable changes when another one does. It’s a way to cut through the noise of data and find a clear pattern.
Think about an ice cream shop. The owner notices they sell more ice cream on hotter days. That makes sense, but can we be more specific? How many more scoops do they sell for every degree the temperature rises? Regression can help answer that question. It takes scattered data points, like daily sales and temperatures, and models the underlying relationship between them.
Dependent and Independent Variables
To talk about these relationships, we need some specific terms. The variable we are trying to predict or explain is called the dependent variable. In our example, that's the number of ice cream scoops sold. Its value depends on other factors.
The variable we think influences the dependent variable is the independent variable. Here, that’s the temperature. We can think of it as the input, or the cause, while the dependent variable is the output, or the effect.
dependent variable
noun
The main variable you are trying to predict or understand. Its value is expected to change in response to other variables.
You can have more than one independent variable. For instance, the ice cream shop owner might also want to see if sales are affected by whether it's a weekday or a weekend. In that case, temperature and day of the week would both be independent variables.
independent variable
noun
A variable that is thought to influence, explain, or cause changes in the dependent variable.
Visualizing the Relationship
The easiest way to see the relationship between two variables is to plot them on a scatter plot. Each point represents a single observation—for example, one day's temperature and its corresponding ice cream sales.
If there's a pattern, the dots will likely form a loose shape. We can then draw a single straight line through the data that best captures the overall trend. This is called the regression line.
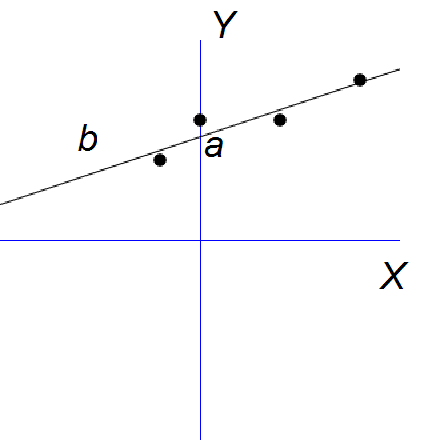
This line is a simple model of the relationship. It doesn't have to pass through every point, but it should be as close to as many of them as possible. It gives us a summary of the trend, like saying "for every 10-degree increase in temperature, we sell about 25 more scoops of ice cream."
The equation for this line is the classic formula you might remember from algebra:
Here, is our dependent variable (sales), and is our independent variable (temperature). The value is the intercept—where the line crosses the vertical axis. It represents the predicted value of when is zero. The value is the slope, which tells us how much changes for a one-unit change in .
Finding the Best Fit
How do we decide exactly where to draw that line? There are many lines we could draw through a cloud of data points. We need a way to find the one that is the "best" fit.
The most common method is called the least squares method. It works by measuring the vertical distance from each data point to the regression line. This distance is called a residual or an error. Some points will be above the line (positive error), and some will be below it (negative error).
To avoid positive and negative errors canceling each other out, we square each one. This makes every error a positive number. The least squares method finds the one unique line where the sum of all these squared errors is as small as possible. In other words, it minimizes the total error, giving us the line that best represents the data.
The goal of the least squares method is to find the line that minimizes the sum of the squared vertical distances between the data points and the line.
Once we have this line, we can use it for two main purposes: inference and prediction. Inference means using the slope to understand the strength and direction of the relationship. Prediction means plugging in a new value for the independent variable to guess what the dependent variable might be.
In a study examining the effect of hours spent studying on exam scores, which variable is the dependent variable?
What is the primary goal of the least squares method in linear regression?