Random Variables and Backtesting Realizations
Random Variables
Numbers for Randomness
When you hear “variable,” you might think of algebra, like the in . A random variable is a different beast. It's not a single unknown number we need to find. Instead, it's a rule that assigns a number to every possible outcome of a random event.
Random Variable
noun
A function that assigns a numerical value to each possible outcome of a random experiment.
Think about flipping a coin. The outcomes aren't numbers; they're "Heads" and "Tails." To analyze this mathematically, we can define a random variable, let's call it , where if the coin lands on heads and if it lands on tails. Now, instead of dealing with words, we have numbers we can work with.
Or consider rolling a standard six-sided die. The random variable, let's call it , could simply be the number that faces up. The possible values for are 1, 2, 3, 4, 5, or 6. This process of linking outcomes to numbers is the core idea behind random variables.
Two Main Flavors
Random variables come in two main types: discrete and continuous. The difference is all about what kind of numbers they can represent.
Discrete random variables can only take on specific, countable values.
Discrete variables are values you can count, even if the list is infinitely long. For example:
- The number of heads in four coin flips (can be 0, 1, 2, 3, or 4).
- The result of a single die roll (1, 2, 3, 4, 5, or 6).
- The number of emails you receive in an hour (0, 1, 2, 3, ...).
There are clear, separate gaps between the possible values. You can't get 2.5 heads or roll a 4.7 on a standard die.
Continuous random variables are the opposite. They can take on any value within a given range. Think of measurements.
Continuous variables can take on an infinite, uncountable number of values within a range.
For example:
- The exact height of a person (could be 1.75 meters, 1.751 meters, 1.7512 meters...).
- The time it takes to run a marathon (could be 3.5 hours, 3.51 hours, 3.514 hours...).
- The temperature in a room.
With a precise enough measuring tool, the value could be anything within a continuous spectrum. There are no gaps.
Assigning Probabilities
Once we have a random variable, we want to know the chances of it taking on its different possible values. This is where probability distributions come in. A probability distribution is a function or table that links each possible value of a random variable with its probability of occurring.
Clearly distinguish between discrete and continuous variables since the approach to probability calculations differs significantly.
For a discrete random variable, we can often list the probabilities for each value in a table. Let's take the random variable , the outcome of a fair die roll. The probability distribution is straightforward.
| Value of Y (y) | Probability P(Y=y) |
|---|---|
| 1 | 1/6 |
| 2 | 1/6 |
| 3 | 1/6 |
| 4 | 1/6 |
| 5 | 1/6 |
| 6 | 1/6 |
This table is called a Probability Mass Function (PMF). It gives us the exact probability for each discrete outcome. Notice that if you add up all the probabilities in the second column, you get 1, which makes sense because one of these outcomes is guaranteed to happen.
For continuous variables, things are a bit trickier. The probability of a continuous random variable being exactly one specific value is zero. Think about it: what are the chances a person is exactly 1.750000... meters tall? Infinitesimally small.
For continuous variables, we don't ask about the probability of a single point. We ask about the probability of a value falling within a range.
Instead of a PMF, continuous variables use a Probability Density Function (PDF). The PDF is a curve, and the probability of the variable falling within a range is the area under the curve for that range.
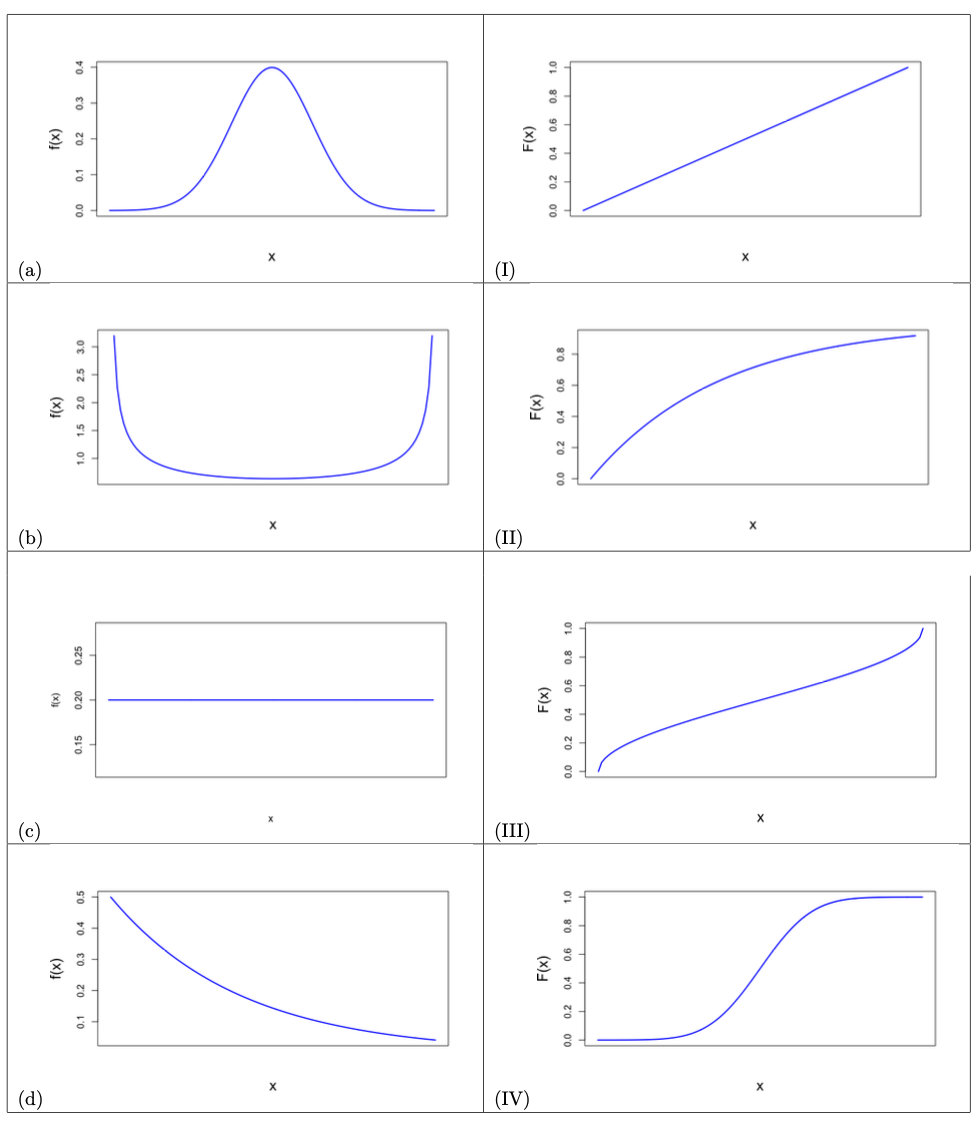
For example, we might ask, "What is the probability that a student's height is between 1.7 meters and 1.8 meters?" We would find that by calculating the area under the PDF curve between those two values. Just like with a PMF, the total area under a PDF curve is always 1, representing 100% of the possibilities.
Understanding random variables and their distributions is the first step in using data to model the uncertainty of the world around us.
What is the primary function of a random variable in statistics?
Which of the following scenarios describes a discrete random variable?